
Evidence / Device
Device validation
First the bench, then people.
Before a measure can mean anything, the device has to record the signal faithfully. We tested CleverPoint 4 in two steps: on a signal generator, where the input is known exactly, and on people, with the classic physiological checks for each signal it records.
Internal test protocol, version 3.2, November 2022: CleverPoint 4 board revision 4.5, EVA 2.102.
1. On the bench
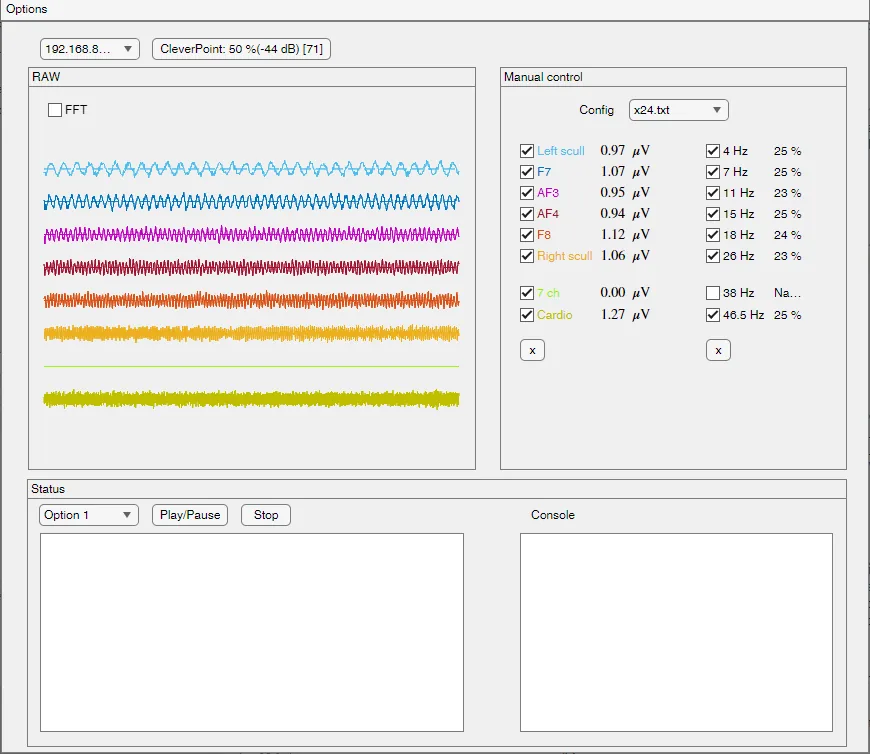
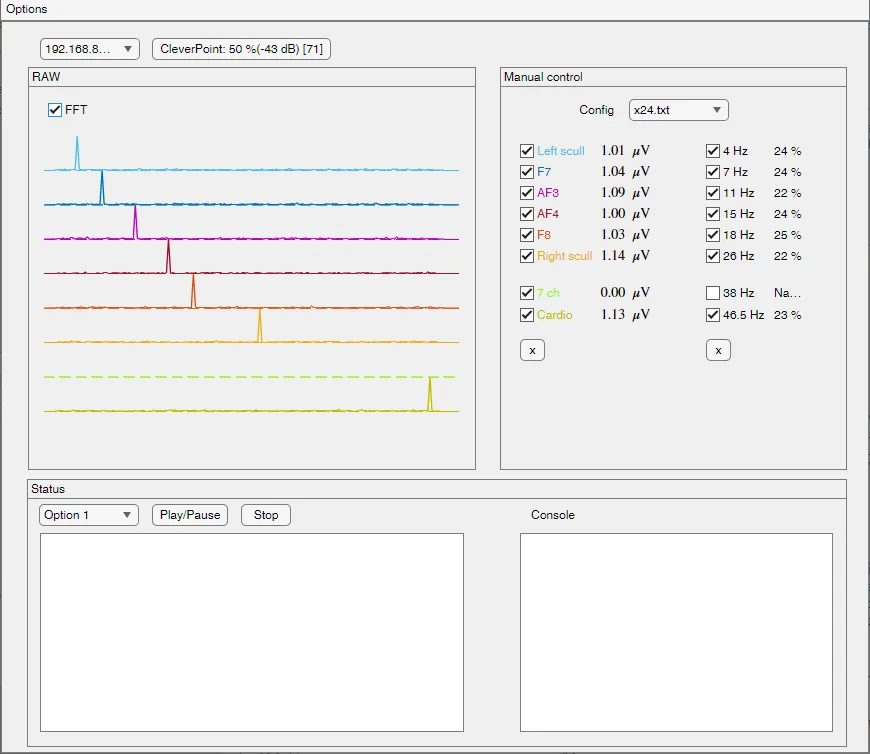
A signal generator fed sine waves of known frequency and amplitude, from 1 to 100 µV and from 4 to 46.5 Hz, into the electrode inputs. Every channel was then compared with what went in.
Frequency response
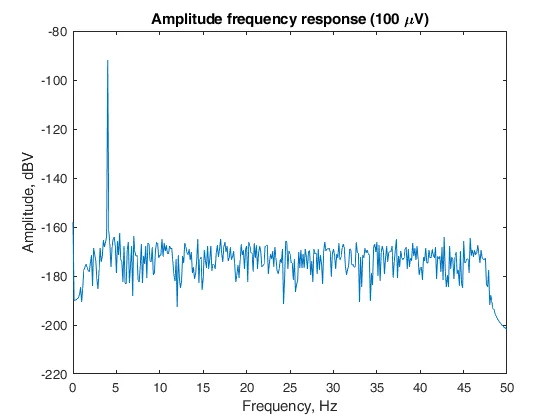
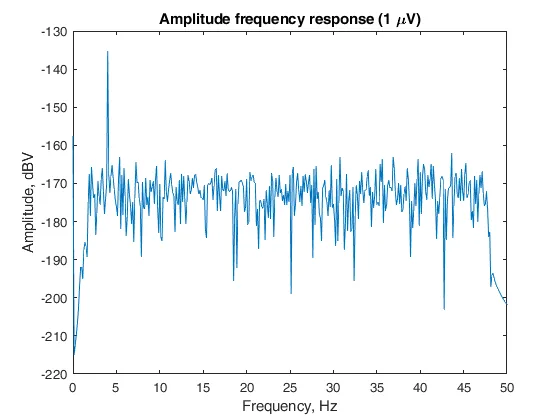
Test signals from 4 to 46.5 Hz, covering the theta, alpha and beta rhythms and the frequencies that carry the timing of each heartbeat, come through as single clean peaks over a noise floor that stays flat up to about 47 Hz, both at 100 µV and at 1 µV, the smallest input tested.
Sensitivity
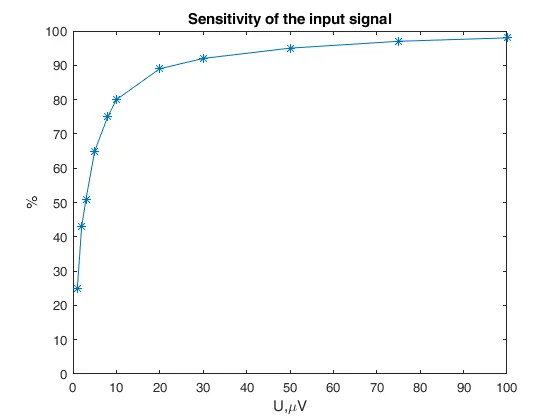
How much of the input amplitude the module returns rises with the input: 25 % at 1 µV, then 80 % at 10 µV, 89 % at 20 µV, 95 % at 50 µV, 98 % at 100 µV. Scalp EEG lies mostly above 10 µV. Heart signals are measured in hundreds of microvolts and more.
2. On people
On the bench the input is known; on a person it is not. So each signal was checked against an effect every physiologist knows to look for.
EEG: the brain follows a flicker
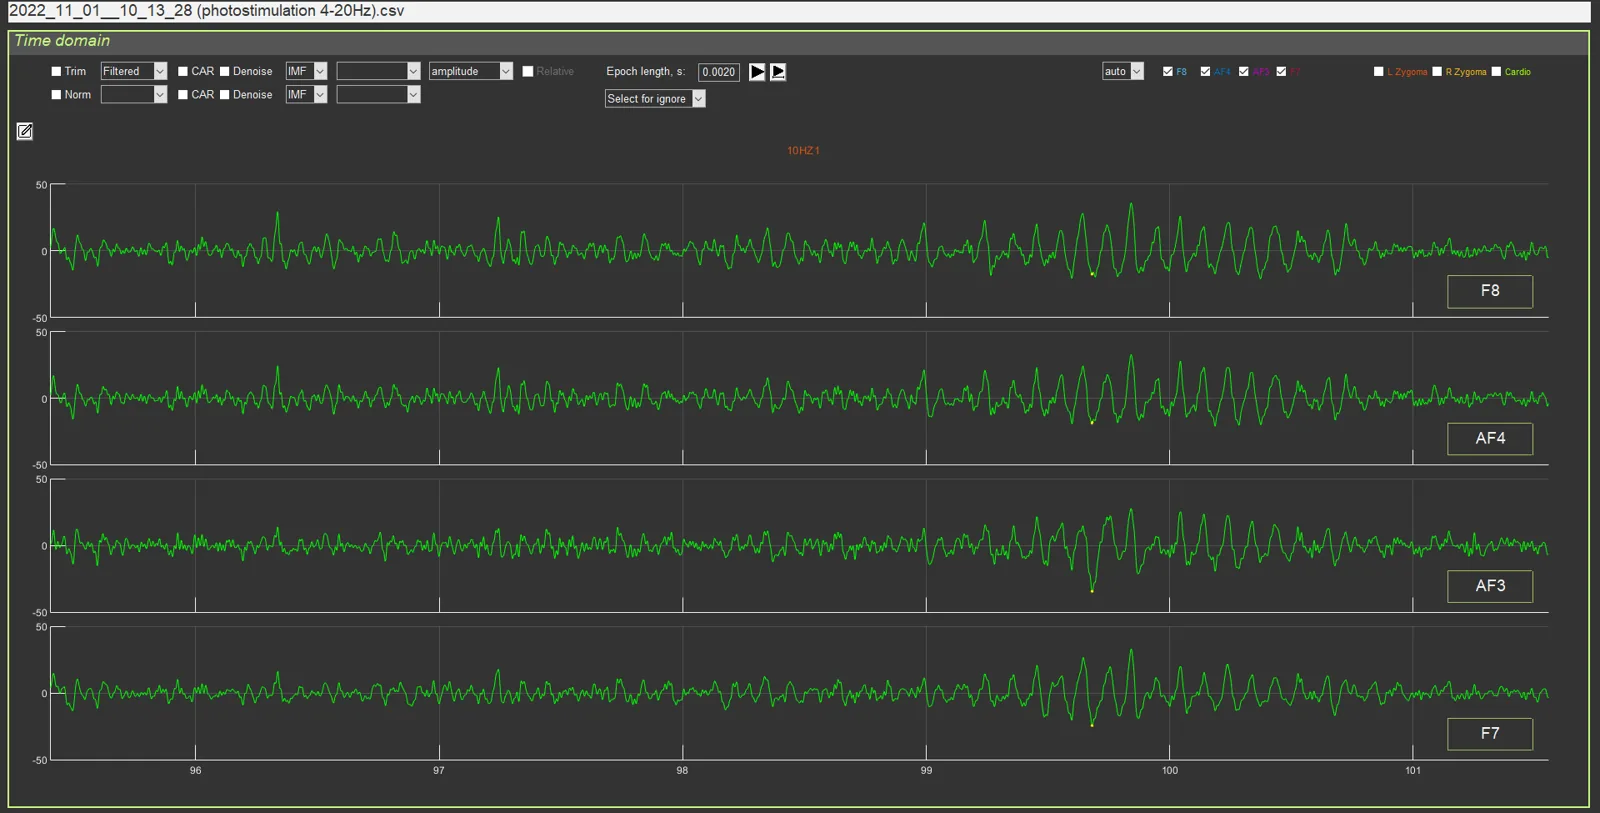
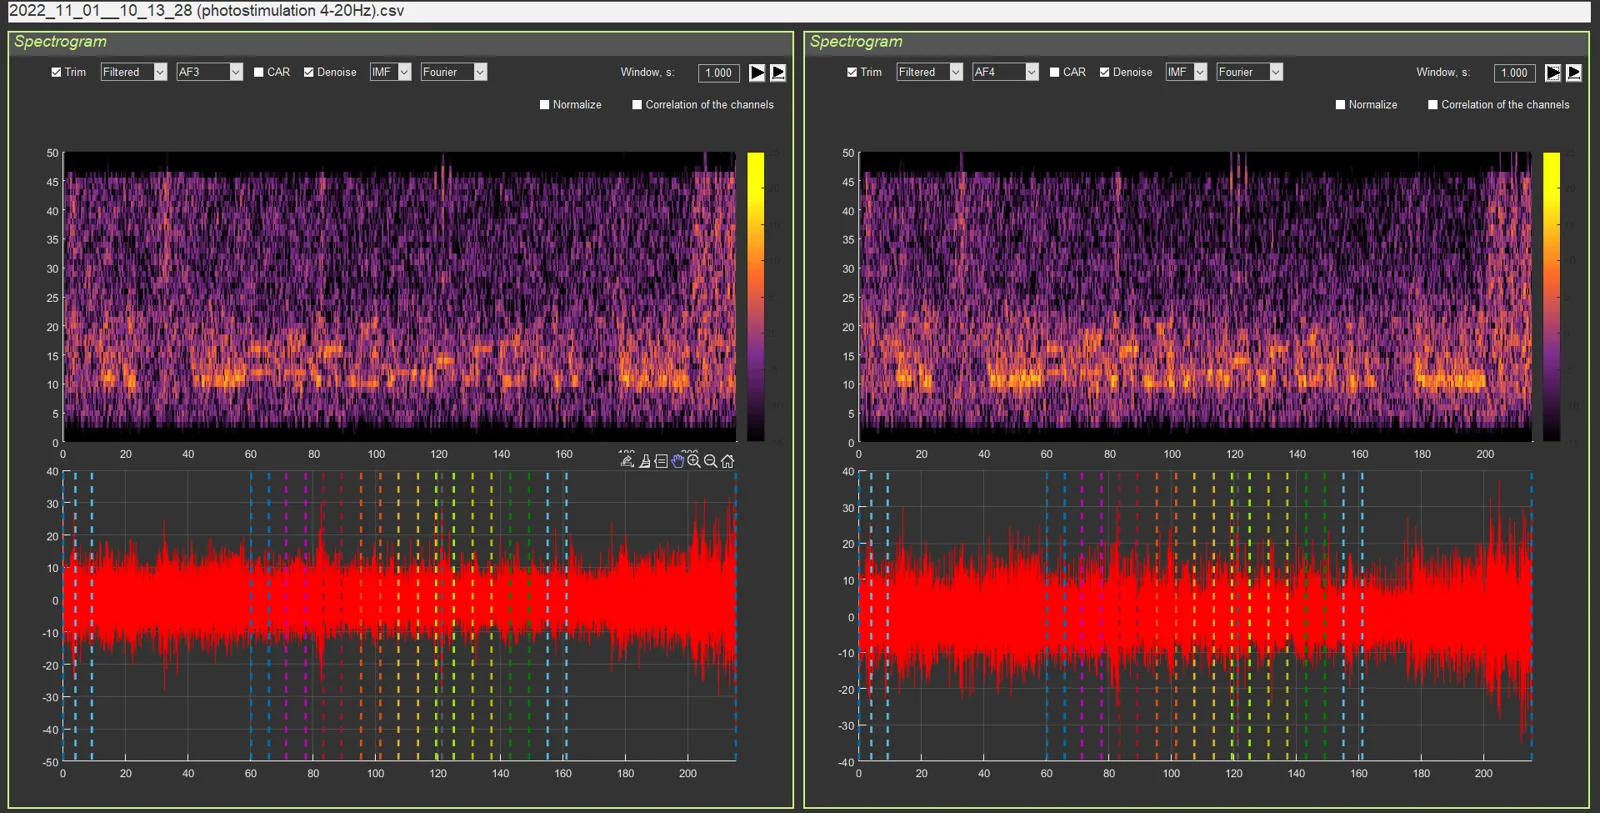
For this check the electrodes were taken off the mask and placed at O1 and O2, over the visual cortex, the standard positions for this paradigm. During light flicker from 4 to 20 Hz the recording picks up the stimulation frequency: at 10 Hz a regular 10 Hz rhythm builds up, and the spectrogram shows a band at the flicker frequency for as long as it lasts. This is photic driving, the classic check that an EEG channel records brain rhythms.
The channel names in the screenshots (F7, AF3, AF4, F8) are the names of the module's inputs; in this recording the inputs were wired to electrodes at O1 and O2.
ECG: the full PQRST shape
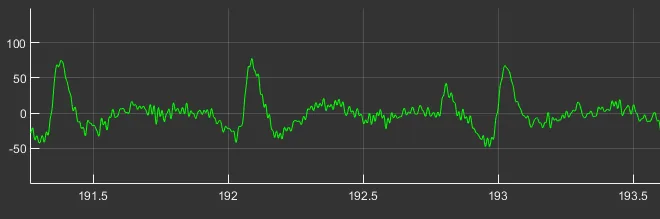
The ECG electrode on the forearm or the back of the hand records the complete cardiac cycle: P wave, QRS complex and T wave, with the R peaks sharp enough for beat-to-beat timing.

Blinks
Blinks show on the frontal channels as the characteristic large, smooth deflections. Stressonika counts them in each task and shows them as an observation.
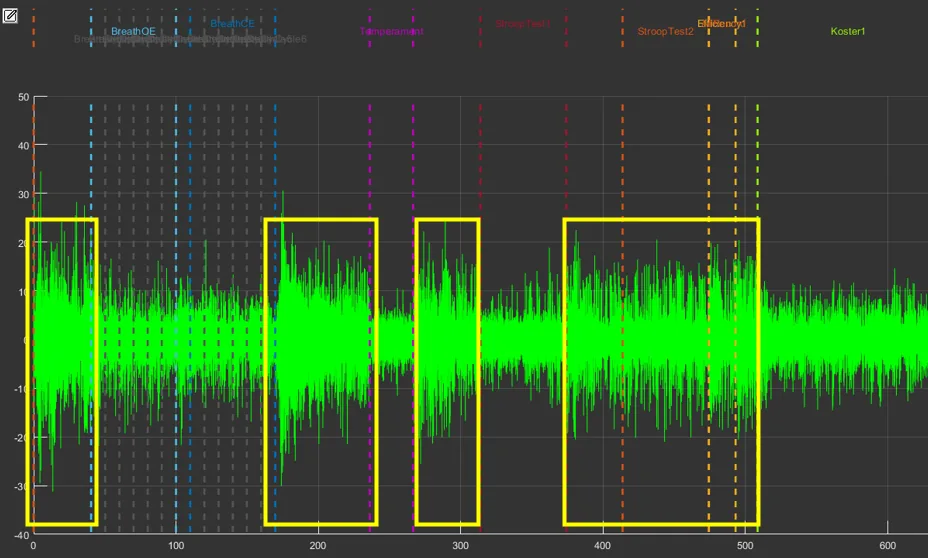
EMG: the forehead works with the task
The first nine minutes of a session on a frontal channel, with the sections marked above. Muscle activity is higher in the boxed stretches, which include tapping and both Stroop tasks, and drops in the rest break that follows.
3. Beat detection
CleverPoint 4 reports each heartbeat interval itself, and our analysis also finds the R peaks in the raw ECG separately, with its own detector. On 30 sessions the two agree to a median of 0.26 bpm in heart rate (90 % of comparisons within 1.26 bpm).
4. Clean, and show the cleaning
Before any measure is computed, the beat series is checked for missed and extra beats, which are corrected. In a typical section nothing needs correcting (median 0 % of beats; mean 2.8 %; 95 % of sections need under 15 %). The report shows the share of corrected beats and adds a quality note when a recording needs one, so the reader always knows what the numbers rest on.