
logo_cleverpointlogo_cleverpointlogo_cleverpointlogo_cleverpoint
  • Book a demo
  • CleverLab
  • Stressonika
    • Use cases
  • Docs
  • Contacts
  • FE
  • EN
  • PL
✕

CleverPoint 4 User Manual

16
  • Introduction
    • Customer Support
    • Regulatory Compliance
    • Warranty and Copyright
  • Product Information
    • Product information
    • Technical specifications
    • Application compatibility
    • Safety precautions
    • Maintenance
  • Getting Started
    • Kit contains
    • Equipment Check
    • Types of CleverPoint 4 Indications
    • Charging your CleverPoint 4
    • Turning CleverPoint 4 on/off
    • First time Wi-Fi setup
    • Connecting CleverMask to the VR Headset
    • Connecting the ECG cable to CleverPoint 4

Stressonika - Guide for Working with raw ECG data

20
  • Introduction
  • Chapter 1. General points.
    • General points
  • Chapter 2. Cardio domain
    • Cardio domain
    • Sector. 1
    • Sector. 2
    • Sector. 3
    • Sector 4
    • Sector 5
    • Sector 6
    • Sector 7
    • Sector 8
  • Chapter 3. Cardio domain: examples
    • Cardio domain: examples
    • 3.1. ECG recording quality
    • 3.2. Preparing the “Cardio domain” page for consultation
    • 3.3 Viewing the “Cardio domain” page during consultation (Example 1)
    • 3.4 . Viewing the “Cardio domain” page during consultation (Example 2)
    • 3.5. Viewing the “Cardio domain” page during consultation (Example 3)
    • 3.6 . Viewing the “Cardio domain” page during consultation (Example 4)
    • 3.7. Viewing the “Cardio domain” page during consultation (Example 5)
    • 3.8. The “Cardio domain” page. Conclusion.

CleverPoint View Data v2.15 User Guide

55
  • Introduction
    • Introduction
  • 0. Fundamentals of Electrophysiology for Beginners
    • 0.1. What Are Physiological Signals?
    • 0.2. Autonomic Nervous System (ANS)
    • 0.3. Emotions and the Brain
    • 0.4. Electrodes and Their Placement in the CleverPoint Setup
  • 1. General Principles of Signal Processing
    • 1.1. Basic Transformations
    • 1.2. Marking and Trim
    • 1.3. CAR (Common Average Reference)
    • 1.4. Denoise (Blink Artifact Suppression)
    • 1.5. Normalize
    • 1.6. IMF (Empirical Mode Decomposition)
    • 1.7. Filtering
    • 1.8. Power vs Amplitude
    • 1.9. Epoch
  • 2. “Summary” Interface
    • 2.1. Purpose
    • 2.2. Controls
    • 2.3. Graphs
    • 2.4. Data Export
  • 3. “Time Domain” Interface
    • 3.1. Purpose
    • 3.2. Controls
    • 3.3. Signal Display
    • 3.4. Signal Transformations
  • 4. “Frequency Domain” Interface
    • 4.1. Purpose
    • 4.2. Interface Structure
    • 4.3. Controls
    • 4.4. Spectral Analysis Methods
    • 4.5. Channel Correlation
    • 4.6. Time Series
  • 5. “Power Domain” Interface
    • 5.1. Purpose
    • 5.2. “Power by sections” Mode
    • 5.3. “Between-channel interactions” Mode
    • 5.4. Frequency-Band Graphs
  • 6. “Coherence” Interface
    • 6.1. Purpose
    • 6.2. Controls
    • 6.3. Coherence Calculation Method
    • 6.4. Display
    • 6.5. Interpretation
    • 6.6. Use in Research
  • 7. “Emotional State” Interface
    • 7.1. Purpose
    • 7.2. Interface Structure
    • 7.3. Controls
    • 7.4. Emotion Calculation Method
    • 7.5. Display
    • 7.6. Section Selection
  • 8. “Cardio Domain” Interface
    • 8.1. Purpose
    • 8.2. Interface Structure
    • 8.3. Controls
    • 8.4. Extraction of RR Intervals
    • 8.5. HRV Parameters
    • 8.6. Visualization
    • 8.7. Data Export
  • 9. Conclusion
    • Conclusion
    • 9.1. Recommendations for Use
    • 9.2. Additional Resources
    • 9.3. Beginner’s Guide
View Categories
  • Home
  • Docs
  • Stressonika - Guide for Working with raw ECG data
  • Chapter 3. Cardio domain: examples
  • 3.7. Viewing the “Cardio domain” page during consultation (Example 5)

3.7. Viewing the “Cardio domain” page during consultation (Example 5)

4 min read

This example will begin with the report data (Fig. 3.34). This is exactly the case when, without raw data, it is impossible to conduct a full consultation based only on the report.

Let us deal with Example 5.

Here the situation is rather confusing: high work efficiency with a low stress level, but the respondent is in the red zone; the functional-state graph begins with moderate fatigue, and the state with the highest tension occurs during the second rest, while the cognitive load was performed in the rest zone, which is difficult to expect during the performance of test tasks.
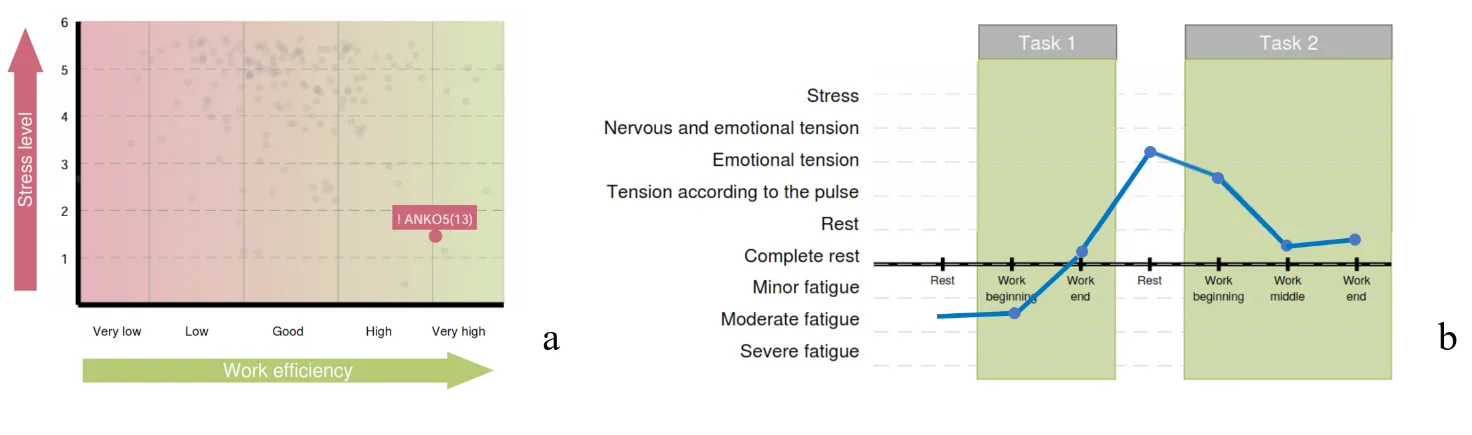
Two charts from a respondent's report: a stress-level-versus-work-efficiency scatter plot with the respondent marked in the very-high-efficiency, low-stress region, and a functional-state line graph across Task 1 and Task 2 that starts at moderate fatigue, peaks at nervous-emotional tension during the rest between tasks, and settles in the rest zone during Task 2.

Figure 3.34. Diagrams of Chapter 3 of the report (Example 5): a – the functional type of performance support; b – the respondent’s functional states in the process of performing test tasks

Let us look at the “Cardio domain” page (Fig. 3.35). What draws attention: pronounced fairly stable bradycardia, with HR fluctuations from 54 (highlighted by a white line in the figure) to 75 beats/min (white arrow); a narrow CIG curve, which indicates low heart rate variability (this is confirmed by the data of Sector 3); red vertical lines (under the red vertical oval in the figure) in Sector 4, with which the CleverView system marks possible extrasystoles (we select this segment and make sure (Fig. 3.36) that some marks identified premature heart contractions correctly); age—59 years with signs of excess body weight—BMI = 27.4; spikes of rest periods are artifacts associated with defects of the ECG recording (yellow arrow).
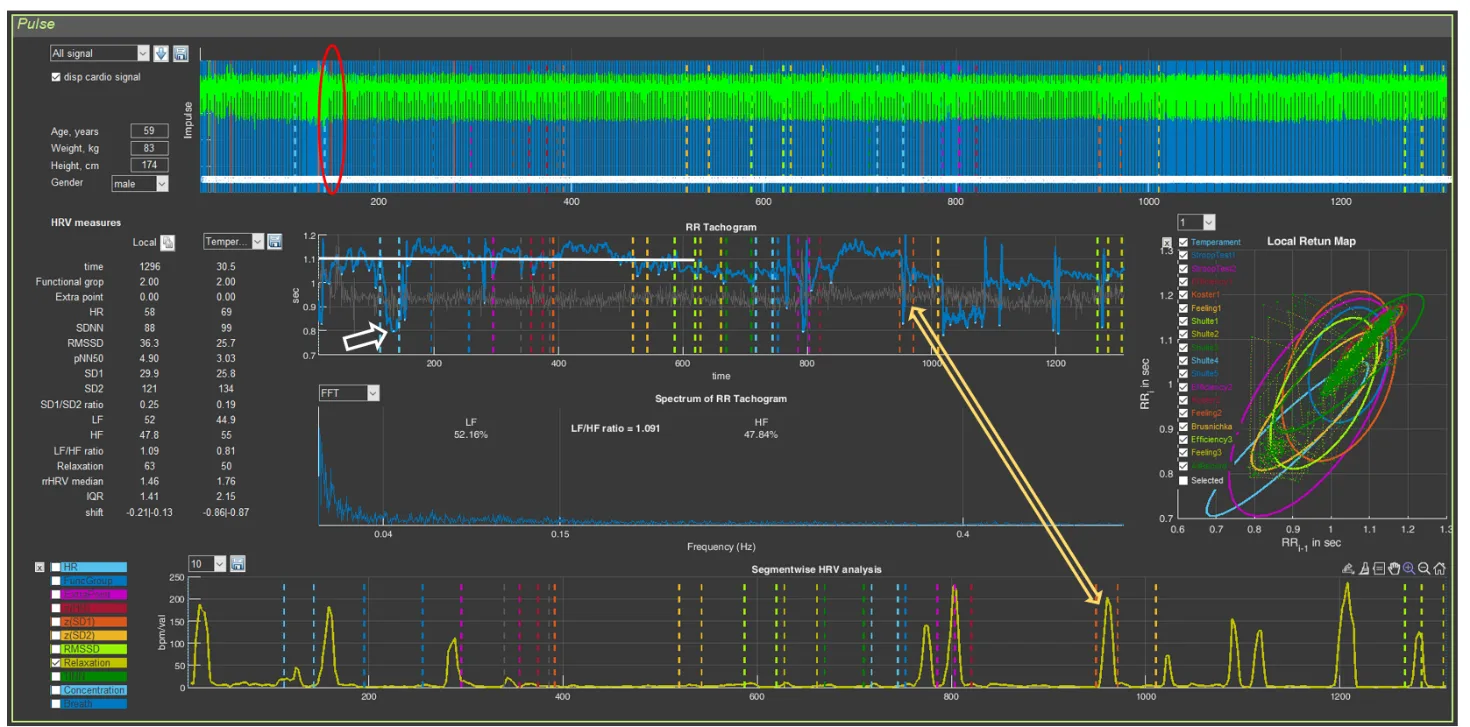
CleverView Cardio domain page (Pulse sector) showing the raw cardio signal strip with a red-circled artifact region, respondent parameters, an HRV measures table for two segments, the RR tachogram with an artifact dip marked by a white arrow, the RR tachogram spectrum, the Local Return Map with colored per-stage ellipses, and the segmentwise HRV analysis curve with a spike linked by a yellow arrow to the tachogram artifact.

Figure 3.35. The respondent’s “Cardio domain” page (Example 5)

Close-up of a raw ECG waveform with detected R-peaks marked by vertical lines and per-beat RR-interval values labeled above the trace, including one beat highlighted in red as a possible artifact.

Figure 3.36. Premature heart contraction—extrasystole (Example 5)

Conclusion: signs of chronic stress with depletion of reserves (in contrast to Example 2) for maintaining an optimal state of the organism, with preserved high cognitive function. Considering the respondent’s age, their attention should be drawn to the need to monitor their health status and to turn to practices for maintaining mental and physical health in order to replenish reserves and reduce the pressure on the organism of the state of chronic stress.

Let us note that respondents with bradycardia, or with a heart rate that, on average over the testing time in Stressonika, does not exceed 70–75 beats/min, are the most difficult for consulting. Thus, in the case of Example 2, only with extensive experience and familiarity with reports and raw data is it possible to conduct a consultation without relying on HRV data. However, such a consultation will still be based on assumptions. To make the conclusions of the report more objective in such cases, it is necessary to analyze ECG and heart rhythm data on the “Cardio domain” page of the CleverView program.

*We have already touched upon the key points of such analysis. Let us repeat:

  1. consider the shape of the cardiointervalogram (CIG) curve (Sector 5), its dynamics (mobility/inertia), and its thickness at different stages;
  2. analyze HRV mobility at the controlled-breathing stages;
  3. assess the shape and organization of the scatter plots visually (Sector 7) and using statistical and mathematical processing methods (Sectors 3 and 6) at the stages where fatigue is detected, and during periods when the respondent was offered rest;
  4. review the ECG curve (Sector 4) for possible episodes of extrasystole.*

Only after this analytical work can an acceptable analysis of the report and reasoned recommendations be provided to the respondent.

Using Example 5, let us illustrate one more possible option for using Sector 8. In Fig. 3.37, this sector reflects the dynamics of the respondent’s functional state throughout the entire testing time. For some, this function may be more visually clear than the rest-level curve. For those who will use this curve, some clarifications and recommendations:

  1. the averaging value should be set to at least 50 (we remind: the window for selecting the averaging measure is under the white oval;
  2. the vertical-value scale is from 0 to 100;
  3. vertical scale values for the functional state indicator: 0 – “Complete rest”; 10 – “Rest”; 20 – “Pulse-based tension”; 30 – “Emotional tension”; 40 – “Nervous-emotional tension”; 50 – “Stress”; 60 – “Mild fatigue”; 70 – “Moderate fatigue”; 80 – “Pronounced fatigue”.

Segmentwise HRV functional-state graph over the session timeline, with a step-line indicator ranging from complete rest to fatigue/tension levels and colored dashed lines marking the boundaries between test stages.

Figure 3.37. Dynamics of the functional state (Example 5)

The functional-state dynamics graph can be compared with Fig. 3.34b. It is obvious that the curve in Fig. 3.37 is more detailed.

P.S.
The study result and the conclusions made “impressed” the respondent and pushed them toward the need to “help” their organism. The approaches they chose in this direction yielded their results (Fig. 3.39).
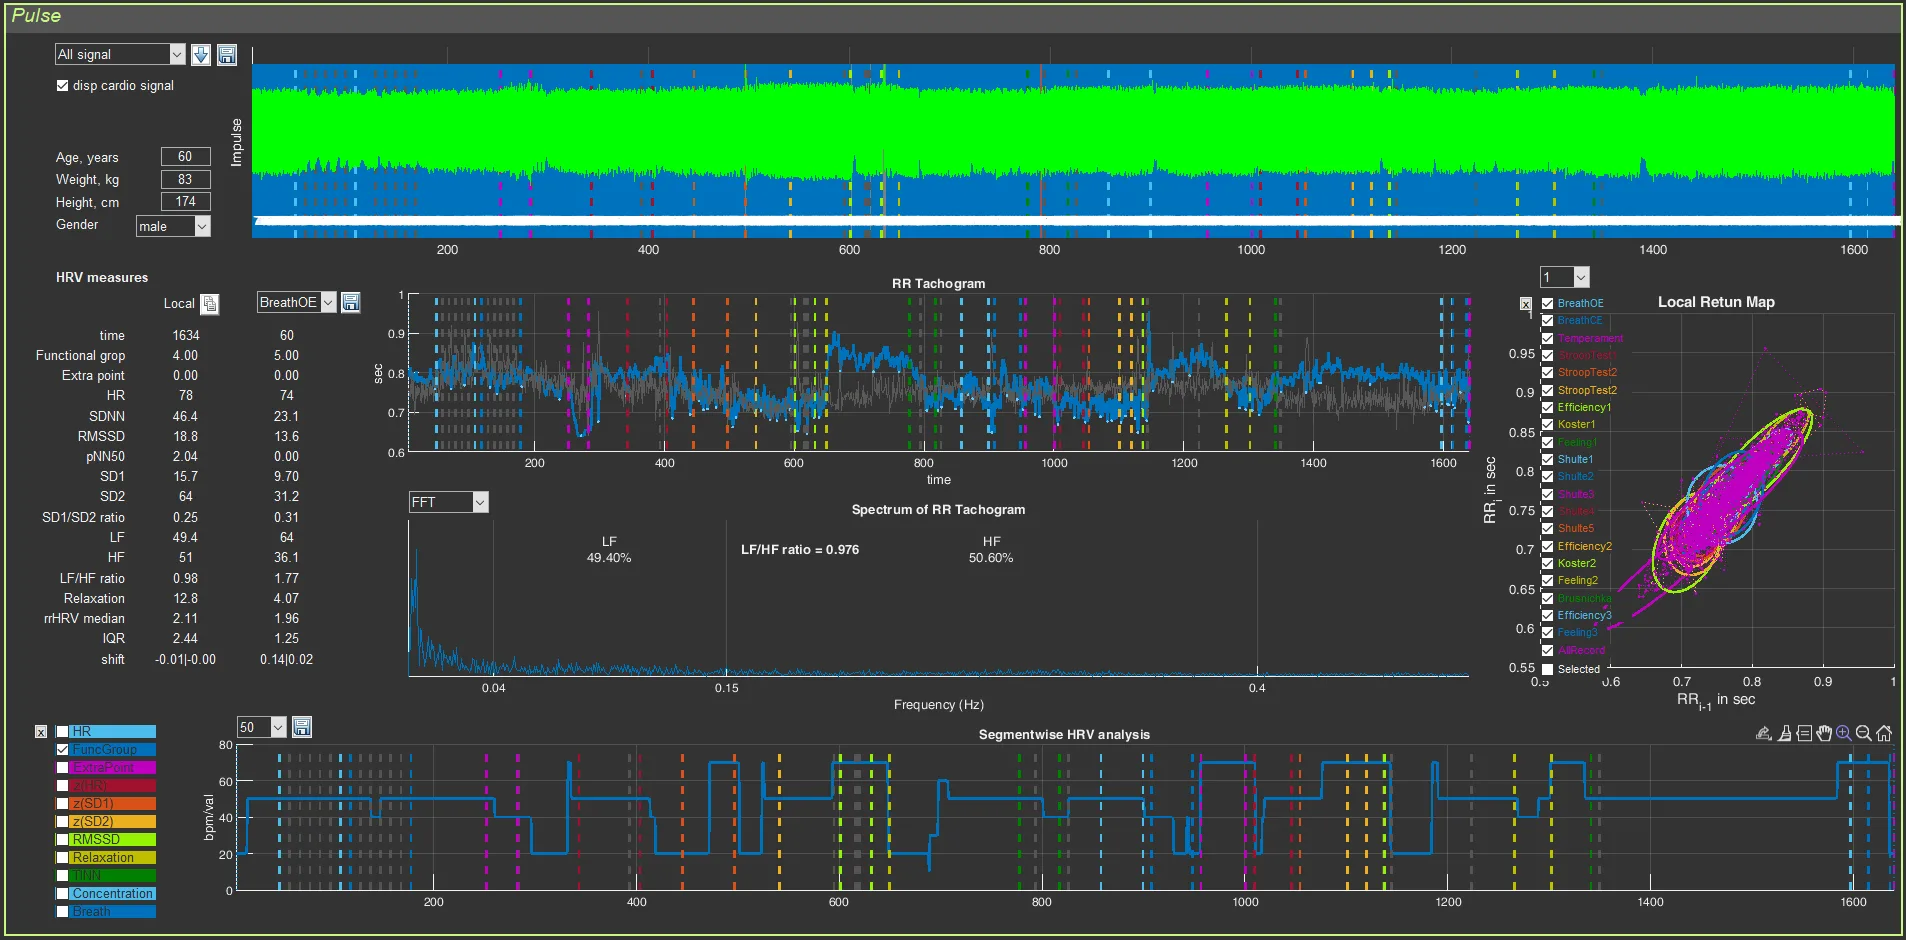
CleverView Cardio domain page (Pulse sector) for a 60-year-old respondent, showing the raw cardio signal, an HRV measures table, the RR tachogram with stage markers, the RR tachogram spectrum (LF/HF ratio 0.976), the Local Return Map with an elongated magenta point cloud and colored ellipses, and the segmentwise HRV/functional-state curve below.

Figure 3.38. The respondent’s “Cardio domain” page after 7 months (Example 5)

Try to draw the conclusions that can be made from the presented figure in comparison with the initial state yourself.

Updated on 31.08.2026

What are your Feelings

  • Happy
  • Normal
  • Sad

Share This Article :

  • Facebook
  • X
  • LinkedIn
  • Pinterest
3.6 . Viewing the “Cardio domain” page during consultation (Example 4)3.8. The “Cardio domain” page. Conclusion.

Our mission

Our mission is to develop products that heighten user awareness of the pivotal role physiology plays in personal and professional endeavors.

We strive to empower our users with the tools to effectively manage stress, prevent burnout, and optimize their well-being.

Contacts

CleverPoint Team - Bukowinska 22, lok 80 Warsaw, Poland, 02-703


+48 578 202 208
[email protected]


All rights reserved. CleverPoint