
logo_cleverpointlogo_cleverpointlogo_cleverpointlogo_cleverpoint
  • Book a demo
  • CleverLab
  • Stressonika
    • Use cases
  • Docs
  • Contacts
  • FE
  • EN
  • PL
✕

CleverPoint 4 User Manual

16
  • Introduction
    • Customer Support
    • Regulatory Compliance
    • Warranty and Copyright
  • Product Information
    • Product information
    • Technical specifications
    • Application compatibility
    • Safety precautions
    • Maintenance
  • Getting Started
    • Kit contains
    • Equipment Check
    • Types of CleverPoint 4 Indications
    • Charging your CleverPoint 4
    • Turning CleverPoint 4 on/off
    • First time Wi-Fi setup
    • Connecting CleverMask to the VR Headset
    • Connecting the ECG cable to CleverPoint 4

Stressonika - Guide for Working with raw ECG data

20
  • Introduction
  • Chapter 1. General points.
    • General points
  • Chapter 2. Cardio domain
    • Cardio domain
    • Sector. 1
    • Sector. 2
    • Sector. 3
    • Sector 4
    • Sector 5
    • Sector 6
    • Sector 7
    • Sector 8
  • Chapter 3. Cardio domain: examples
    • Cardio domain: examples
    • 3.1. ECG recording quality
    • 3.2. Preparing the “Cardio domain” page for consultation
    • 3.3 Viewing the “Cardio domain” page during consultation (Example 1)
    • 3.4 . Viewing the “Cardio domain” page during consultation (Example 2)
    • 3.5. Viewing the “Cardio domain” page during consultation (Example 3)
    • 3.6 . Viewing the “Cardio domain” page during consultation (Example 4)
    • 3.7. Viewing the “Cardio domain” page during consultation (Example 5)
    • 3.8. The “Cardio domain” page. Conclusion.

CleverPoint View Data v2.15 User Guide

55
  • Introduction
    • Introduction
  • 0. Fundamentals of Electrophysiology for Beginners
    • 0.1. What Are Physiological Signals?
    • 0.2. Autonomic Nervous System (ANS)
    • 0.3. Emotions and the Brain
    • 0.4. Electrodes and Their Placement in the CleverPoint Setup
  • 1. General Principles of Signal Processing
    • 1.1. Basic Transformations
    • 1.2. Marking and Trim
    • 1.3. CAR (Common Average Reference)
    • 1.4. Denoise (Blink Artifact Suppression)
    • 1.5. Normalize
    • 1.6. IMF (Empirical Mode Decomposition)
    • 1.7. Filtering
    • 1.8. Power vs Amplitude
    • 1.9. Epoch
  • 2. “Summary” Interface
    • 2.1. Purpose
    • 2.2. Controls
    • 2.3. Graphs
    • 2.4. Data Export
  • 3. “Time Domain” Interface
    • 3.1. Purpose
    • 3.2. Controls
    • 3.3. Signal Display
    • 3.4. Signal Transformations
  • 4. “Frequency Domain” Interface
    • 4.1. Purpose
    • 4.2. Interface Structure
    • 4.3. Controls
    • 4.4. Spectral Analysis Methods
    • 4.5. Channel Correlation
    • 4.6. Time Series
  • 5. “Power Domain” Interface
    • 5.1. Purpose
    • 5.2. “Power by sections” Mode
    • 5.3. “Between-channel interactions” Mode
    • 5.4. Frequency-Band Graphs
  • 6. “Coherence” Interface
    • 6.1. Purpose
    • 6.2. Controls
    • 6.3. Coherence Calculation Method
    • 6.4. Display
    • 6.5. Interpretation
    • 6.6. Use in Research
  • 7. “Emotional State” Interface
    • 7.1. Purpose
    • 7.2. Interface Structure
    • 7.3. Controls
    • 7.4. Emotion Calculation Method
    • 7.5. Display
    • 7.6. Section Selection
  • 8. “Cardio Domain” Interface
    • 8.1. Purpose
    • 8.2. Interface Structure
    • 8.3. Controls
    • 8.4. Extraction of RR Intervals
    • 8.5. HRV Parameters
    • 8.6. Visualization
    • 8.7. Data Export
  • 9. Conclusion
    • Conclusion
    • 9.1. Recommendations for Use
    • 9.2. Additional Resources
    • 9.3. Beginner’s Guide
View Categories
  • Home
  • Docs
  • Stressonika - Guide for Working with raw ECG data
  • Chapter 2. Cardio domain
  • Sector 7

Sector 7

3 min read


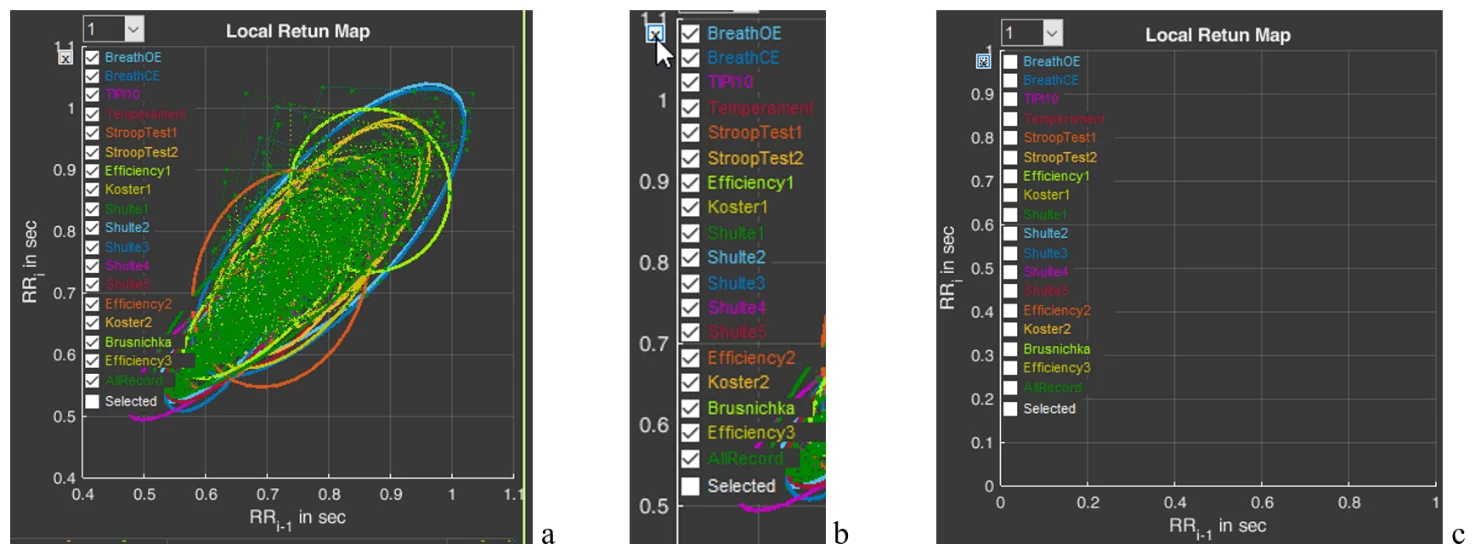
Sector 7 contains a scatter plot, or a Poincare plot. With respect to HRV, this is a graphical method for displaying the relationship between successive R-R intervals (cardiac cycles). When constructing this plot, the position of each point is determined by two coordinates: on the ordinate axis (vertical axis) – the duration of the RRi interval, on the abscissa axis (horizontal axis) – the preceding one, RRi-1 (Fig. 2.23a). By default, the sector immediately displays plots for all stages (Fig. 2.23a). On the left side, a column is displayed with the names of all these stages (in our example, Stressonika), marked with the corresponding color (as are the plots in the sector) and with a window where the activation mark is set (Fig. 2.23b). You can visualize the stages that interest you by removing the activation mark or setting it. You can clear the plot field at once by clicking on the cross in the upper left corner (Fig. 2.23b). The result of this action is shown in Fig. 2.23c.
Three Local Return (Poincare) Map panels: (a) all episode checkboxes checked, showing overlapping colored fitted ellipses and scattered RR-interval points for every episode; (b) the episode checkbox list with the cursor over the clear-plot icon; (c) the plot cleared with all checkboxes unchecked, leaving an empty graph.

Figure 2.23. HRV Poincare plot in sector 7 and the ability to control the image on the plot (explanations in the text)

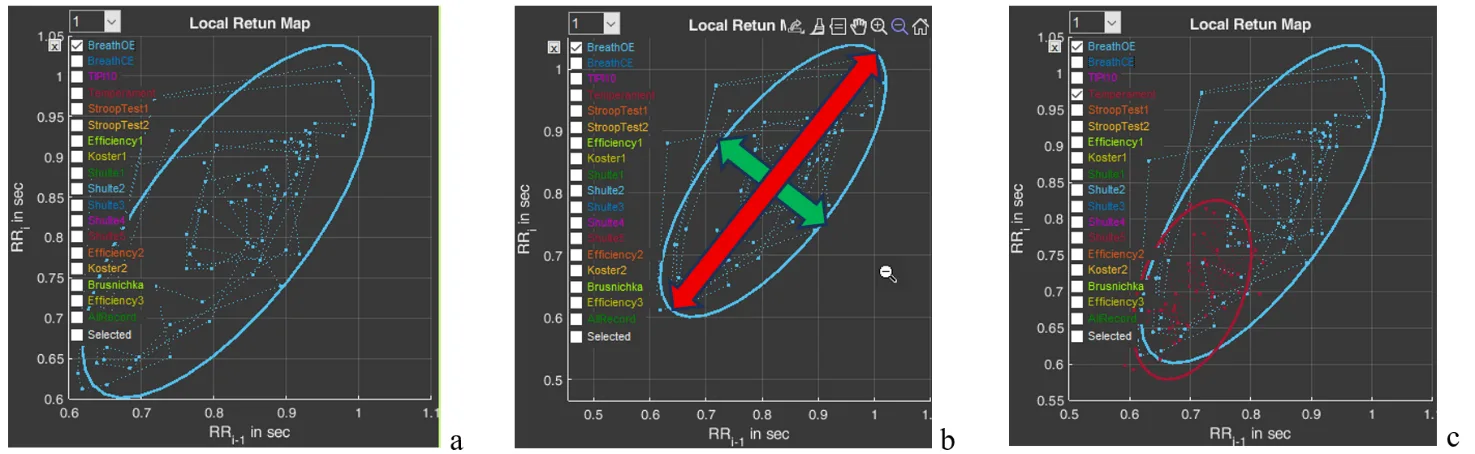
Activate the Poincare plot on the graph only for the “BreathOE” stage (Fig. 2.24a). We remember that the plot scale can be controlled using the functional icons (Fig. 2.24b). It is possible to activate plots not for one, but for several stages for comparison (Fig. 2.24c).
Three Local Return (Poincare) Map panels: (a) only the BreathOE episode checked, showing a single blue Poincare ellipse of RR intervals; (b) the same plot with red arrows marking the ellipse's SD1 (minor axis) and SD2 (major axis) directions; (c) two episodes, BreathOE and Temperament, overlaid to compare their differently sized and oriented Poincare ellipses.

Figure 2.24. HRV Poincare plot for the “BreathOE” stage (explanations in the text)

Now a few words about the scatter plot. The HRV Poincare plot is a visual representation of the integral picture of HRV, which makes it possible to assess the activity of regulatory systems by the shape of the “cloud” of points: a compressed cloud may indicate low variability; by the location of the cloud one can judge HR (we remind you that the smaller the RR-interval value, the higher the HR, and vice versa); the symmetrical shape of the oval outlining the cloud and its optimal form indicate a balance of the autonomic nervous system; significant outliers of points beyond the main cloud most often indicate a significant rhythm disturbance.

The cloud itself is assessed by the shape of the oval drawn around it and by the values of SD1 (the width of the cloud – the green arrow), SD2 (the length of the cloud – the red arrow) (Fig. 2.24b) and their ratio SD1/SD2 (see Table 1).

Using the plot, it is possible to: trace how the body adapts to stress (in the case of Stressonika, this is cognitive stress); assess the balance between the sympathetic and parasympathetic divisions of the autonomic nervous system; track how HRV changes over time under the influence of certain effects, for example, breathing practices.

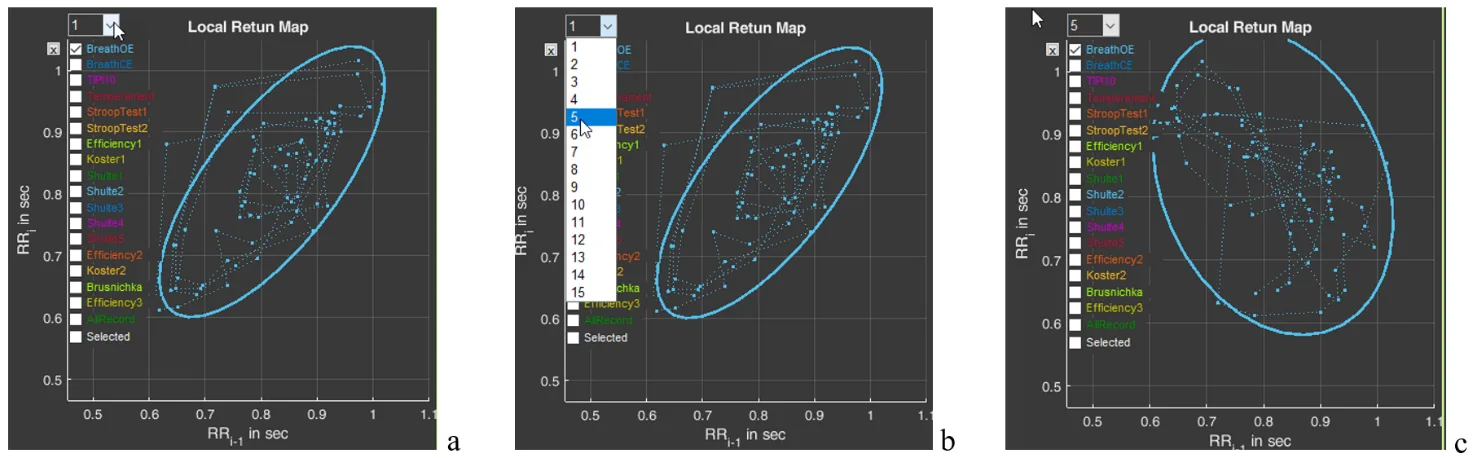
And one more function of sector 7 is the window with the number 1 (Fig. 2.254a). The number can be changed by activating this window (Fig. 2.25b). For example, we selected the number 5 (Fig. 2.25c). As can be seen, the shape and position of the cloud have changed. This is because on the abscissa axis we selected not the value RRi-1, but the value RRi-5. This function is needed to search for an autocorrelation dependence. But this is already for very advanced scientific research work.
Three CleverView Local Return Map panels comparing RRi-1 vs RRi lag settings: panels a and b use lag 1 with an elongated point cloud and fitted ellipse, while panel c uses lag 5, showing a rounder, more scattered cloud used to search for autocorrelation dependence.

Figure 2.25. Search for an autocorrelation dependence using the “BreathOE” stage as an example (explanations in the text)

Please note that two line segments extend from each point of the diagram, forming an angle. This is the same angle that is taken into account when constructing the histogram we described above (Fig. 2.22).

Updated on 31.08.2026

What are your Feelings

  • Happy
  • Normal
  • Sad

Share This Article :

  • Facebook
  • X
  • LinkedIn
  • Pinterest
Sector 6Sector 8

Our mission

Our mission is to develop products that heighten user awareness of the pivotal role physiology plays in personal and professional endeavors.

We strive to empower our users with the tools to effectively manage stress, prevent burnout, and optimize their well-being.

Contacts

CleverPoint Team - Bukowinska 22, lok 80 Warsaw, Poland, 02-703


+48 578 202 208
[email protected]


All rights reserved. CleverPoint