And now let us consider CleverView data of a respondent who complains of chronic fatigue (Fig. 3.25).
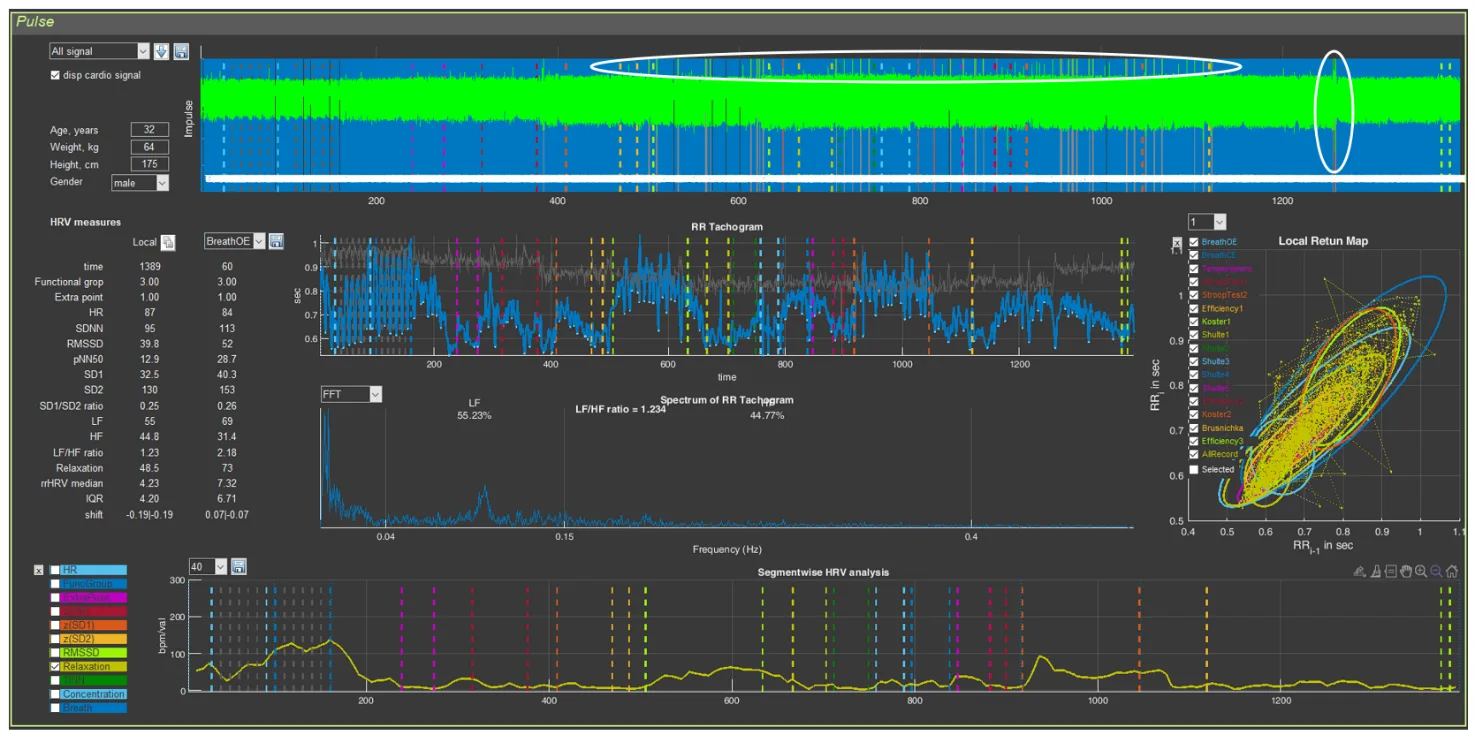
Figure 3.25. The respondent’s “Cardio domain” page (Example 3)
Recording quality? There are problems (Fig. 3.25): a segment of the recording defect on the last test is highlighted by a vertical oval, and single defects at the rest stages and Schulte tables are highlighted by a horizontal oval. A detailed analysis showed that these problematic segments of the recording do not have a significant effect on the overall picture.
For clarity, let us present the CIG in a separate image and mark the zones of our attention (Fig. 2.26): 1 – during controlled rare breathing, high-amplitude waves of respiratory arrhythmia are clearly visible; 2 – a mobile reaction to the beginning of various psychometric tests with an HR shift toward tachycardia (up to 100 beats/min); 3 – during the proposed rest periods, recovery of a more slowed rhythm of heart contractions is noted (down to 70 beats/min); 4 – the cardiac-rhythm reaction during the last test is similar to that described at the beginning of this chapter (see Fig. 3.2).
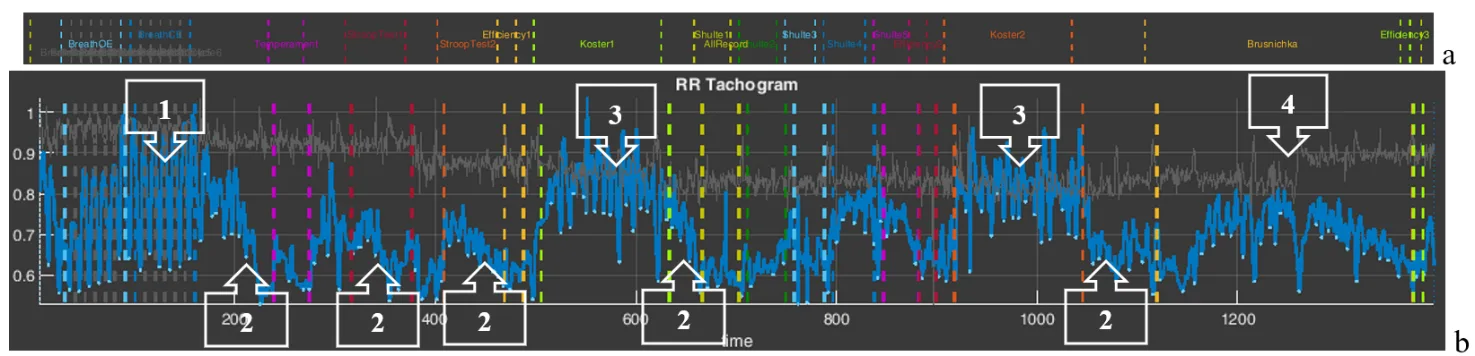
Figure 3.26. The respondent’s CIG acceptable for analysis (Example 3).
Note: a – an element of the “Time domain” page describing the testing stages in Stressonika.
1. Slow breathing, especially with eyes closed (Fig. 3.27), exactly corresponds to the set rhythm. The shape of the CIG during respiratory arrhythmia (Fig. 3.27a) and the scatter plot (Fig. 3.27c) are close to optimal.
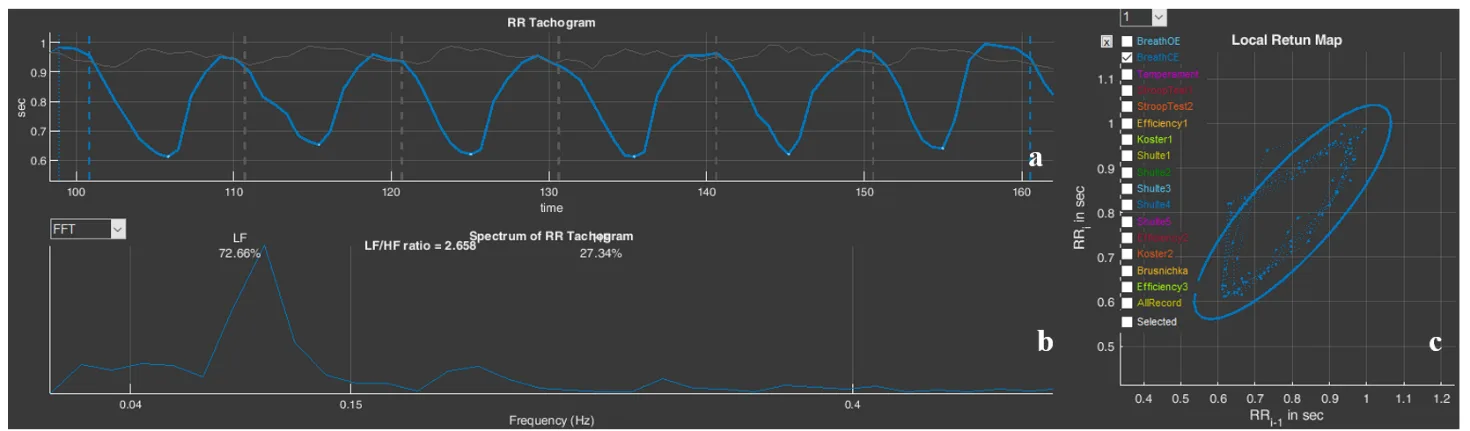
Figure 3.27. The respondent’s “BreathCE” stage (Example 2): a – cardiointervalogram; b – spectrogram; c – scatter plot
2. Mobility of nervous processes, according to the report (Fig. 3.28b), is high, which is emphasized by the autonomic reaction to the beginning of cognitive tests and the identified cognitive style (Fig. 3.28a). At the same time, work performance is above average (Fig. 3.28c).
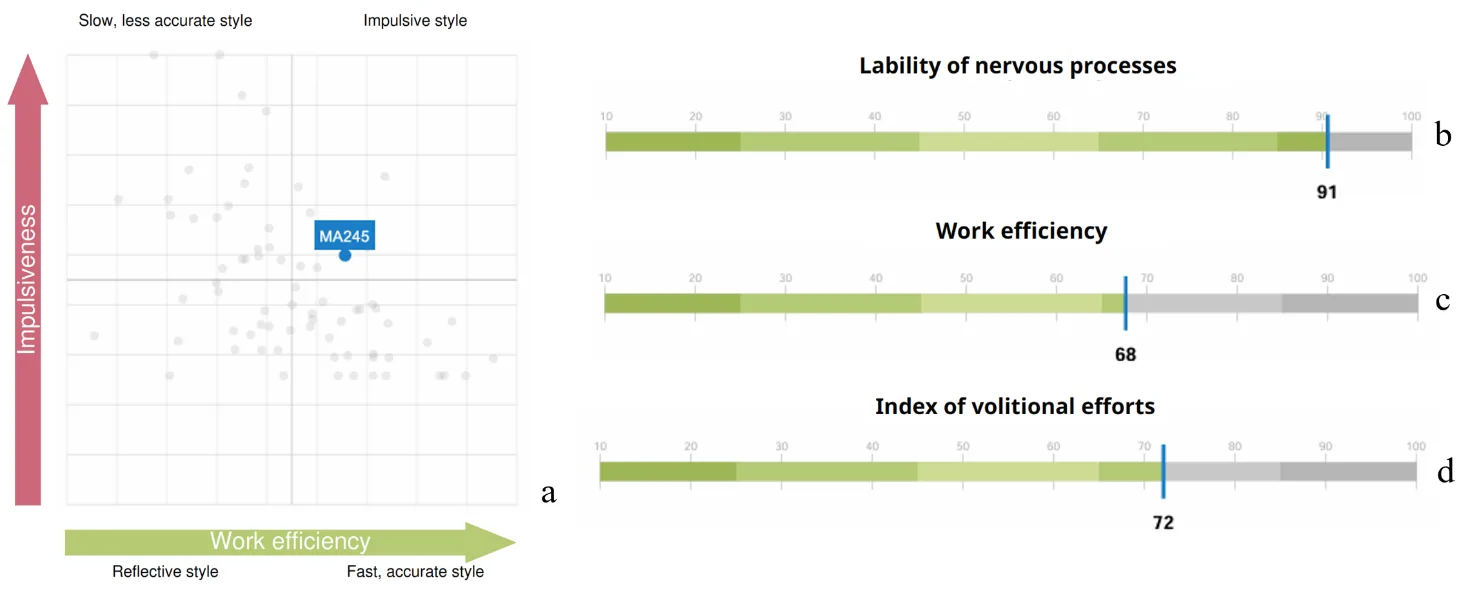
Figure 3.28. Graphs from the report (Example 3): a – cognitive style diagram; b – nervous system mobility; c – work performance; d – volitional effort indicator
3. During the rest periods, HR decreases, which is illustrated by the mean level of the CIG (Fig. 2.29a). The arrows (Fig. 2.29a,c) indicate segments with R waves that were not recognized (see comments to Fig. 3.25 and Fig. 3.5), which, however, weakly affects the overall background of the cardiointervalogram curve. At the same time, signs of respiratory arrhythmia can be noted both on the CIG itself and on the spectrogram in the form of a distinct peak (Fig. 3.29b).
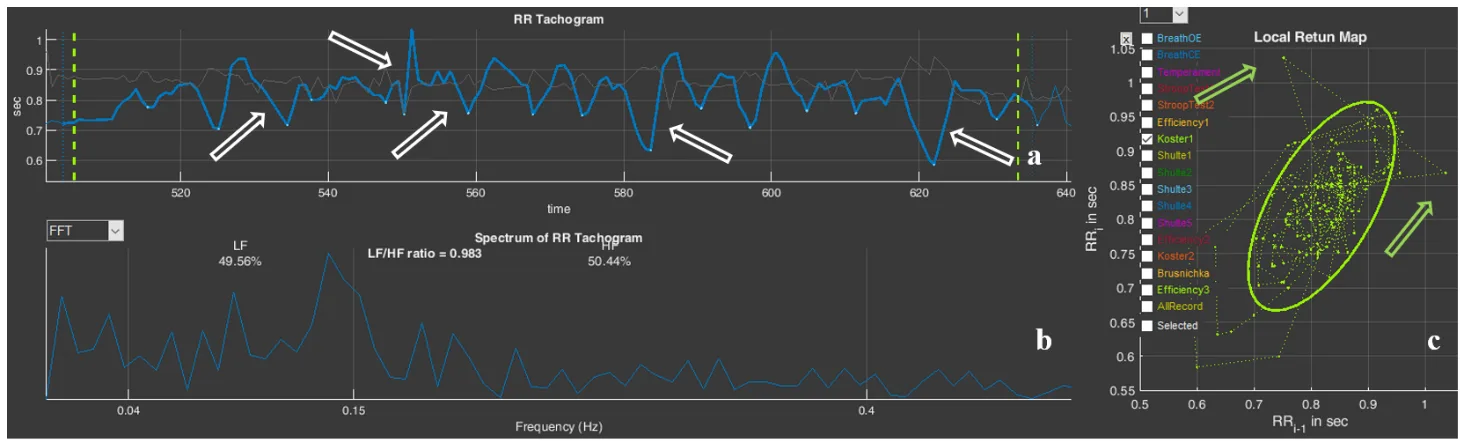
Figure 3.29. The respondent’s “Koster1” stage (Example 3): a – cardiointervalogram; b – spectrogram; c – scatter plot
4. A high volitional effort indicator (Fig. 3.28d) indicates that, despite the signs of fatigue that were observed during the last test, the respondent is able to concentrate on the assigned task and bring it to completion.
The impression is created that the respondent is not in a state of chronic stress. This is also confirmed by the information of Chapter 3 of the report (Figs. 3.30 and 3.28a).
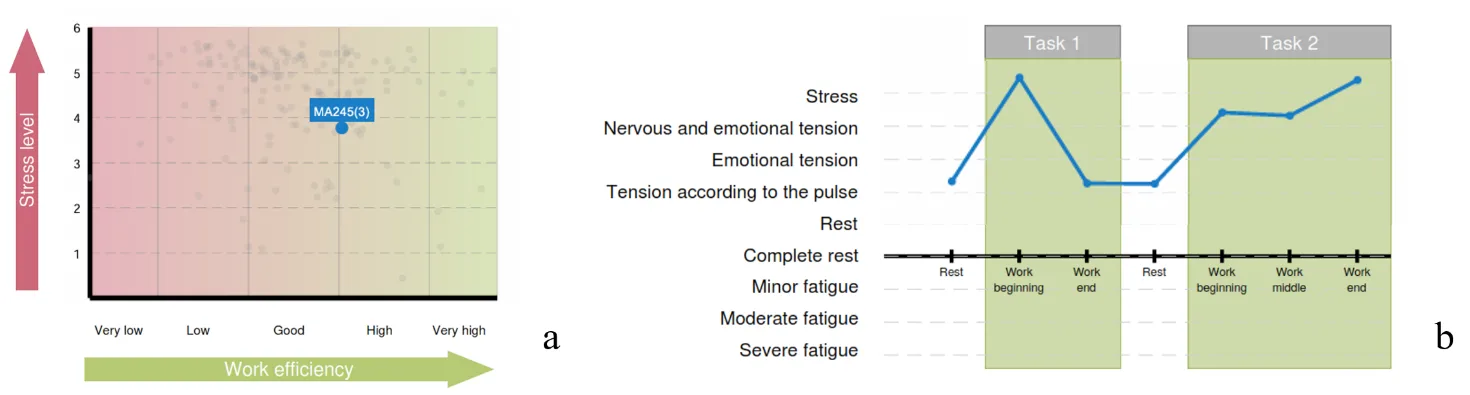
Figure 3.30. Diagrams of Chapter 3 of the report (Example 3): a – the functional type of performance support; b – the respondent’s functional states in the process of performing test tasks
However, the conclusions we have made do not at all mean that the respondent should not complain of fatigue. We can only assume that the cause of these complaints is not a state of chronic stress. It is possible that such a type of response to a stressor, with a relatively low strength of the nervous system (according to the report), under the “pressure” of volitional efforts, leads to short-term but frequent states of fatigue. In addition, besides chronic stress, there are many other reasons that can form such a sensation. This needs to be dealt with. But this is already a problem that lies outside the scope of this manual.