Our first example will be the visualized biometric data shown in Fig. 3.9.
The first thing to pay attention to before starting the consultation is assessment of the recording quality (see above). In Sector 4, a sufficiently high-quality ECG recording is observed, which makes it possible to draw conclusions for the entire report.
If the ECG recording is unsuitable for analysis, immediately inform the respondent that you will not be able to conduct a full consultation based on the report!
The second thing to which we recommend paying attention is the anthropometric data (Sector 2). We see: age 31 years, female, weight 50 kg, height 1.63 m. The body mass index (BMI) can be calculated ≈ 18.8. The BMI value is rather significant information (Table 3.1) that may be useful during consultation.
Table 3.1. Body mass index and its assessment
| Body mass index | Correspondence between a person’s weight and height |
| 16 or less | Pronounced body mass deficit |
| 16–18.5 | Body mass deficit |
| 18.5–25 | Normal |
| 25–30 | Excess body mass |
| 30–35 | Obesity, degree 1 |
| 35–40 | Obesity, degree 2 |
| 40 or more | Obesity, degree 3 |
We remind you how BMI is calculated: BMI = m / h², where m is weight (kg) and h is height (m)
Now you can proceed to the description of the report.
We do not want to impose any consultation model on you! You may first go through the entire report, and only then draw the respondent’s attention to the “Cardio domain” page, linking the information contained there to the results described in the relevant chapters of the report.
You may conduct the consultation based on the report in parallel with referring to this page in CleverView.
You may build the consultation plan according to some other logic.
In this manual, we provide only examples of the interrelation between the information presented in the report and illustrated on the “Cardio domain” page of the CleverView program, and of interpreting the page’s graphs as a supplement to the report.
Chapter 3 of the report is the one most closely related to the “Cardio domain” page. Two diagrams of Chapter 3 of the respondent’s report, whose primary data were taken by us as the first example, are presented in Fig. 3.11. For assessing the respondent’s psychoemotional state and their individual reaction to stress, these diagrams are the most important.
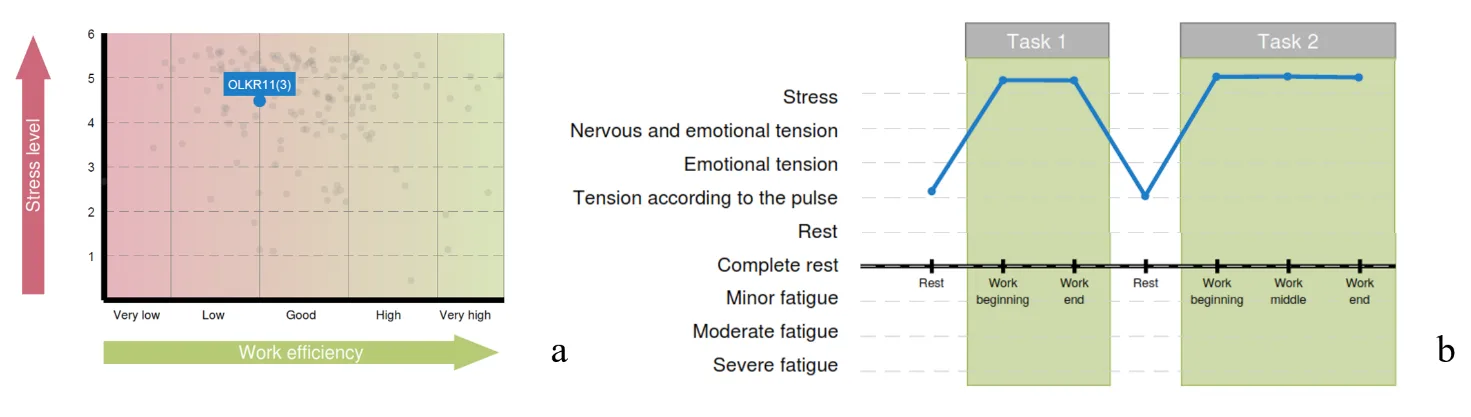
Figure 3.11. Diagrams of Chapter 3 of the report: a – functional type of work capacity support; b – functional states of the respondent in the process of performing test tasks
Let us begin with the diagram “Functional type of work capacity support” (Fig. 3.11a). Note the rather high position on the “Stress level” scale, the borderline position between “low” and “good” on the “Work efficiency” scale, and the blue fill color of the respondent’s position mark on the diagram. In the diagram “Functional states of the respondent in the process of performing test tasks”, the intensity of the psychoemotional state during testing in Stressonika and its dynamics are already indicated in terms of certain functional states (Fig. 3.11b). The diagram clearly shows that during the 2-minute periods of the proposed rest the respondent was able to return to a state adequate to the test conditions at those moments. On the CIG curve of the “Cardio domain” page (Fig. 3.12), this dynamics is only confirmed: during all periods of cognitive tests the respondent was in a state of stress, as indicated by a decrease of the CIG or an increase in HR (pink and red segments), and it increases during rest periods (blue segments). Note that both tension and rest states are quite stable: RR intervals, with the exception of the StroopTest1 period, where a sharp increase in HR is visible (RR interval = 0.51 s, which corresponds to HR = 117.6 bpm), fluctuate approximately within the same range (Fig. 3.11b). To understand the difference between mobility and stability of heart rhythm, let us compare Figs. 3.2 and 3.11b.
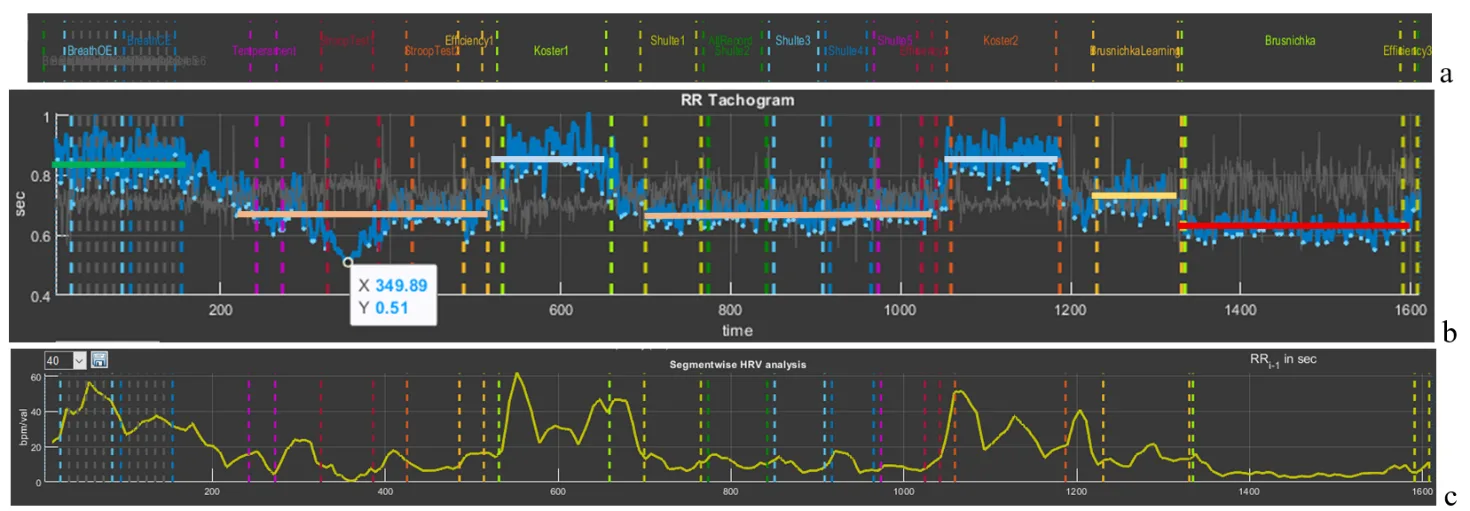
Figure 3.12. Interdependence of the graphs of Sector 5 and Sector 8 if heart rate values are displayed on the latter
The ability to return to a state of relative rest (we remember that “
rest is only a dream”) after tension is a remarkable quality of an individual, which indicates the absence of chronic stress and/or a balance of the sympathetic and parasympathetic nervous systems. It is not by chance that the fill color of the respondent’s position on the diagram “Functional type of work capacity support” is blue. Figure 3.12c, reflecting the dynamics of relaxation intensity, only emphasizes what has been described above. Your reasoning about HR can be supported by the data of Sector 3 if HRV data of a particular testing stage are displayed in the right column (Fig. 3.13). In the figure, HR data are highlighted by a red stripe; the data above it, already in digital form, consolidate our observations.
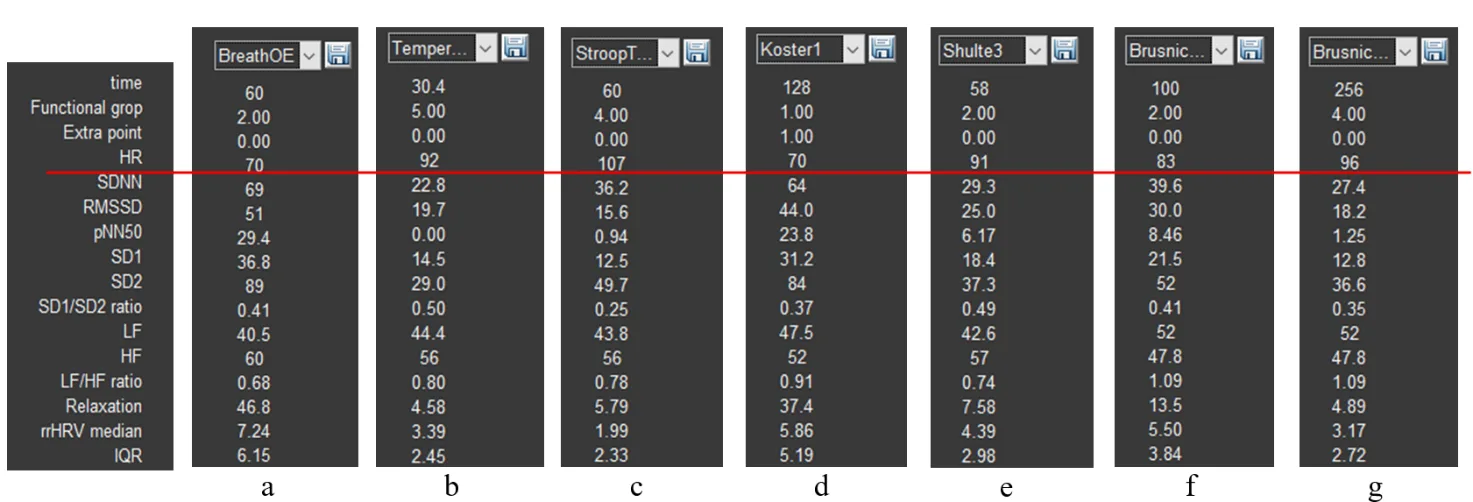
Figure 3.13. HRV indicators: a – controlled slow-breathing stage with eyes open; b – tapping test stage; c – Stroop test 1 stage; d – first rest stage; e – Schulte table 3 stage; f – training stage for the color test with names of fruits and vegetables; g – stage of performing the color test with names of fruits and vegetables.
The third diagram of Chapter 3 of the report reflects the respondent’s cognitive style (Fig. 3.14a). The tested individual’s position falls into the “Slow inaccurate style” zone. Let us remember that during test performance our participant was in a state of stress. This allows the conclusion that this state is not the most productive for their cognitive activity. Methods of emergency workload or brainstorming are not their element.
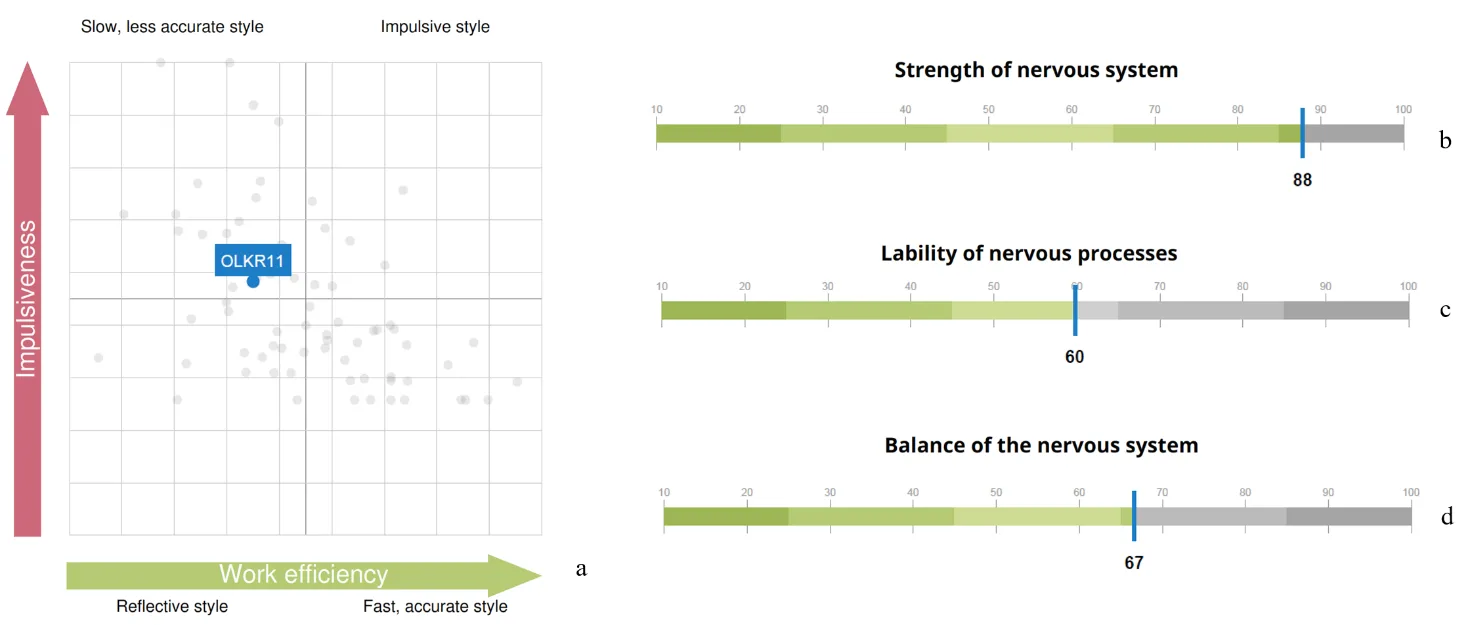
Figure 3.14. Graphs of Chapters 3 and 4 of the report: a – cognitive style diagram; indicators of nervous system strength (b), mobility (c), and balance (d)
It can be assumed that the results presented in Chapter 4 of the report – “Properties of the nervous system” (Fig. 3.14a,b,c) – are reflected in the CIG pattern: the ability to maintain such a functional state as stress at the same level for a long time – strength of the nervous system; the ability to quickly switch from a state of stress to “pulse tension” – mobility; a sufficiently wide band of RR interval fluctuations, as well as some HRV indicators (e.g., SD1/SD2) – balance.
In addition to the report, the respondent can also be told about other observations.
1. Even during testing it was noticeable how the respondent emotionally reacted to the last test. In Fig. 3.12b this stage is highlighted by a red segment that is clearly lower than other parts of the CIG, which confirms the tested person’s involvement in the process of the assigned tasks. Highlighting the RR-interval distribution cloud in Sector 7 of this stage (bright green) in comparison with the slow-breathing task (blue), which models a rest state, clearly shows that the cloud of the last test is located markedly lower and occupies a smaller area (Fig. 3.15a). This location and shape indicate activity of the sympathetic nervous system, which is manifested by an increase in HR and a decrease in HRV.
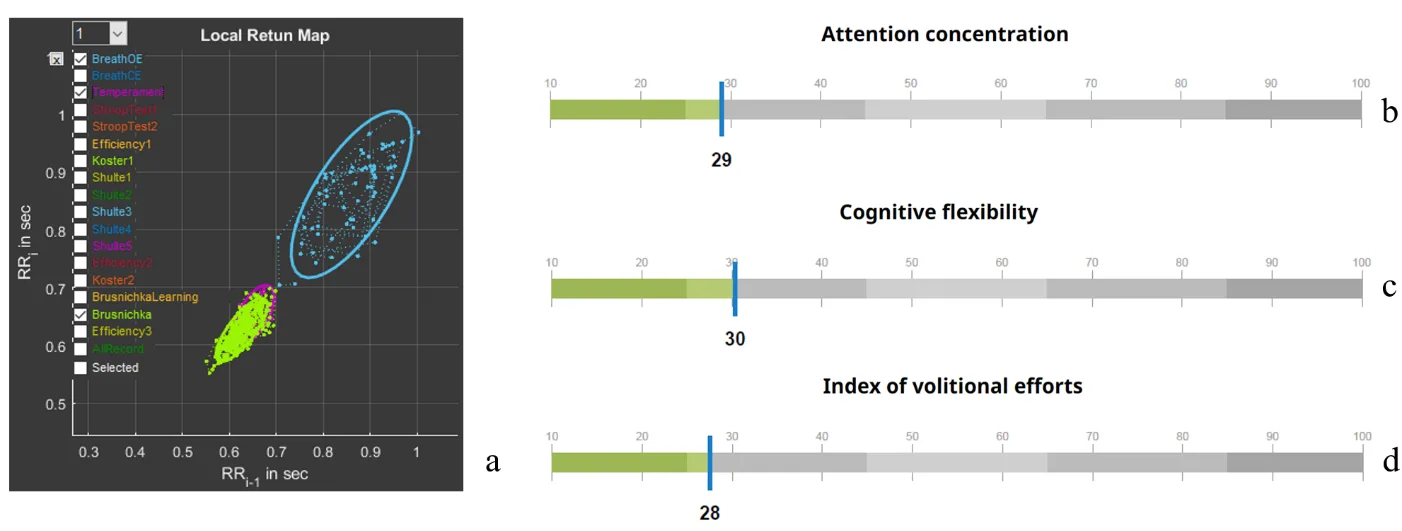
Figure 3.15. a – scatter plot (Sector 7); report indicators of attention concentration (b), cognitive flexibility (c), and volitional effort (d)
At the same time, now in concrete numbers (Fig. 3.15b,c), indicators of cognitive functions are below average values. Thus, involvement in the last test did not affect the overall assessment of these indicators and did not influence efforts to overcome the fatigue factor at the end of the test (Fig. 3.15d). It has already been concluded that a state of stress is not the best one for the respondent’s work performance. Even under a positive emotional background, the style of work under stress is more reminiscent of fussiness.
Indicators of cognitive functions are not calculated on the basis of a single test. This should be kept in mind when we evaluate manifestations of autonomic changes during the performance of any specific stage in Stressonika.
2. A rather important stage is the first two tasks of controlled slow breathing. In subsection 3.1 of this chapter, the significance of this functional trial has already been discussed. Therefore, it is desirable to discuss the data of the “BreathOE” and “BreathCE” stages with the respondent. Activate in Sector 1 the stage with eyes open (OE) (Fig. 2.3b), select (following the example in Fig. 2.5b, but in Sector 5) this stage on the CIG, and in Sector 7 activate the stages “BreathOE”, “Koster1”, and “Temperament” (Fig. 3.16).
In Sector 5, a time range of 1 min is selected (Fig. 3.16a). On the CIG curve, 9 waves of sinusoid-like oscillations of RR intervals are visible, i.e., 9 per minute. Such a shape indicates that these oscillations occurred in accordance with respiratory movements. On the spectrogram in such cases, a peak is clearly visible whose frequency value corresponds to the number of waves on the cardiointervalogram (Fig. 3.16b). Let us check: the peak frequency is 0.152 Hz, which, converted to the number per minute, is 0.152 * 60 = 9.1. We remember that, according to the instruction, the respondent was supposed to breathe at a rate of 6 respiratory movements per minute. The same pattern was observed at the stage with eyes closed – “BreathCE”. There is a topic for discussion: why the respondent breathed at a different rate. Possibly they did not understand the instruction, due to discomfort or for some other reason; perhaps breathing practices are not suitable for the respondent as training tools for achieving a state of relaxation.
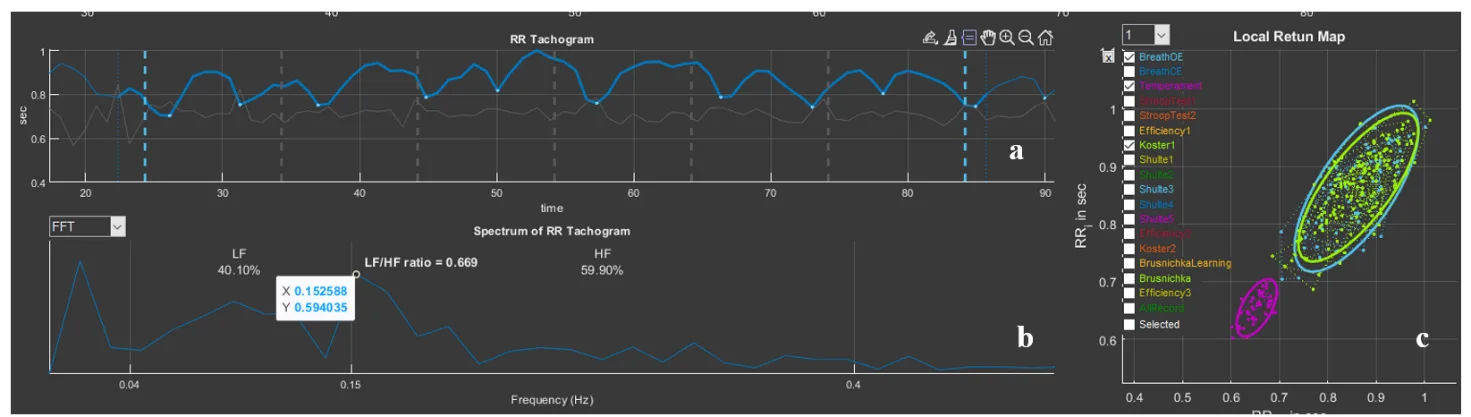
Figure 3.16. “BreathOE” stage on the “Cardio domain” page prepared for consultation
Be that as it may, respiratory arrhythmia is clearly visible on the CIG, i.e., correspondence of changes in RR interval values to the phases of respiration: inhalation/exhalation. More often such correspondence is observed in a rest state; therefore, the form (cloud) of the RR-interval distribution in Sector 7 can be taken as a comparison state with other stages (blue color), for example, the rest period (bright green) and the “Temperament” stage (violet), which most often is supported by the maximum activity of the sympathetic nervous system (Fig. 3.16c).
3. Now the first rest stage can be considered in more detail (Fig. 3.17). On the CIG (we remember that this stage lasts 2 min) signs of respiratory arrhythmia are observed, but not as organized as it was during the “BreathOE” stage (Fig. 3.17a). The fact that at this stage there is no clear relationship between respiration and RR-interval oscillations is also confirmed by the absence of a pronounced peak on the spectrogram (Fig. 3.17b). However, the RR-interval distribution “cloud” (bright green) almost exactly coincides with the cloud of the controlled breathing period. It can be concluded that at this time the respondent was in a state of relative rest, which has already been stated when discussing the report.
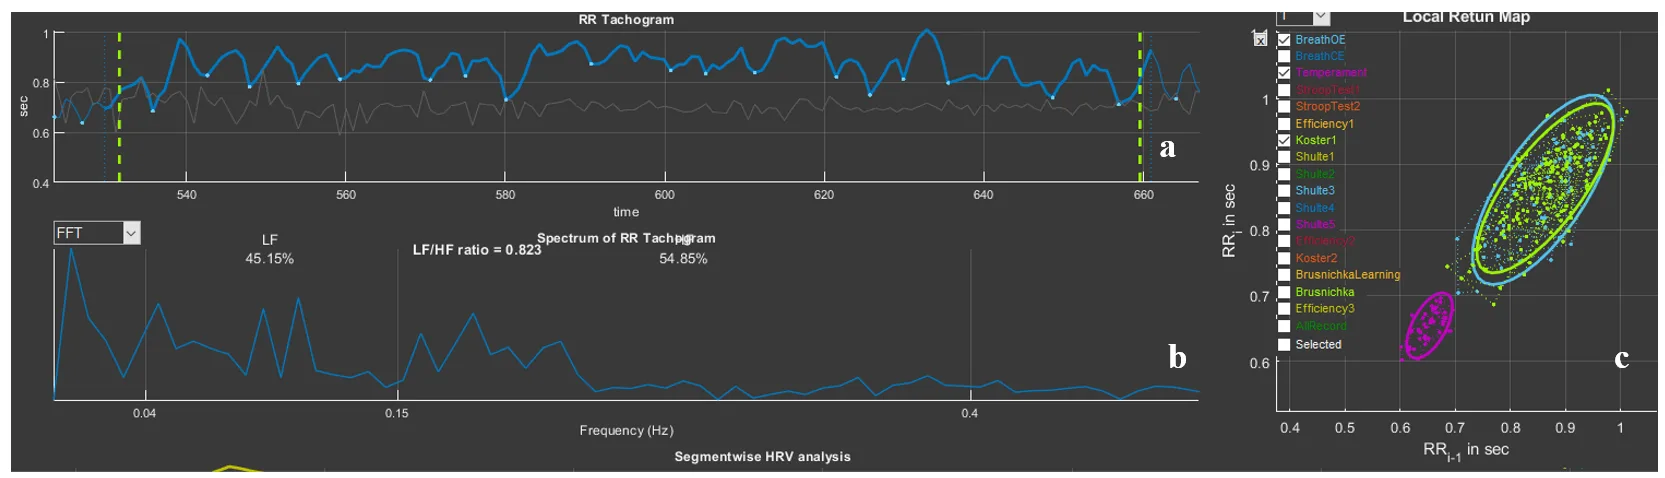
Figure 3.17. “Koster1” stage on the “Cardio domain” page prepared for consultation
Based on the first example, perhaps one more emphasized remark can be made: Stressonika does not assess the level of intelligence, and low indicators of cognitive functions are not a reason for sharp and unambiguous conclusions. The database on which the indicator scales in the report are built is a range of normal values! The task of Stressonika: assessment of a person’s functional state, burnout risk, ability to perform cognitive tasks under stress, identification of individual characteristics of a person’s response in a state of emotional tension, provision of objective data for self-knowledge, revealing to a person their strong and weak properties of the body’s functioning, development of strategies for optimal performance of tasks at work and in everyday life, and restoration of the balance of internal mechanisms that determine the quality of our life.
We hope that the first example was sufficiently useful for understanding the philosophy embedded in Stressonika.