We tactfully yet persistently recommend that you conduct consultation based on the report, emphasizing (illustrating, confirming, accentuating, proving, etc.) your conclusions (reasoning, findings, recommendations, assumptions, etc.) with the respondent’s data displayed on the “Cardio domain” page. Figure 3.9 shows a sample, in our view, of how this page should look for consultation. All subsequent illustrations will correspond to the respondent’s primary data visualized in this figure.
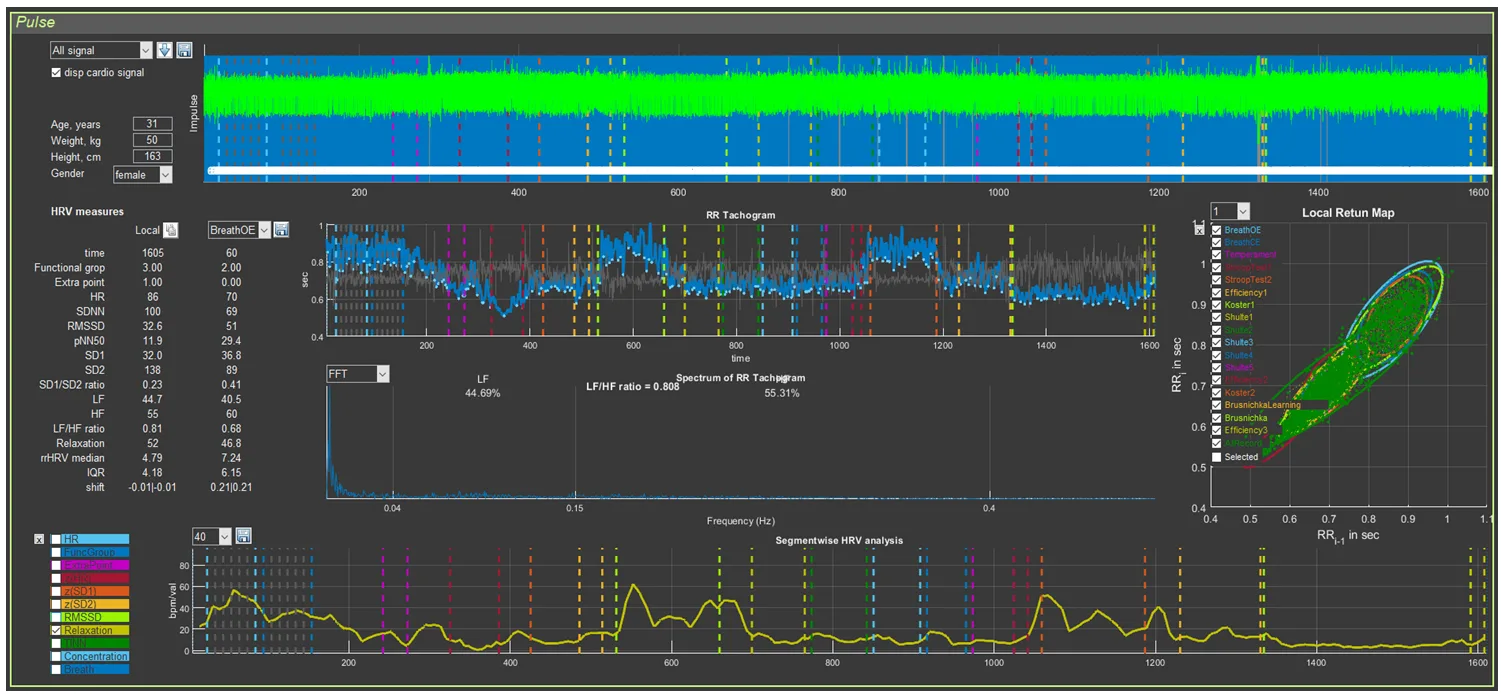
Figure 3.9. “Cardio domain” page prepared for consultation
This page will also be the main one in the work of researchers whose interests are related to heart rate variability.
How the image in Sector 4 is formed has already been discussed. It remains only to clarify the graph of Sector 8. For this, it will be necessary to return to the information in Chapter 2 devoted to this sector (Table 2; Figs. 2.27 and 2.28). From Table 2 it can be seen that, for most indicators, the scientific component predominates. For assessing the respondent’s functional state, the greatest interest is HR (HR on the graph) and the level of relaxation (Relaxation). In Figs. 2.27 and 2.28, a heart-rate graph is shown as an example. However, it was previously stated that the RR interval of Sector 5 is the inverse of HR: the smaller the RR interval (a decrease of the graph in Sector 5), the higher the HR (an increase of the graph in Sector 8), and vice versa. This relationship is illustrated separately in Fig. 3.10. Essentially, these graphs reflect the same thing, being in mirror symmetry. When commenting on the CIG, one rather quickly gets used to speaking in terms of HR. Therefore, displaying the HR graph separately in Sector 8 is of little informative value, unlike the relaxation dynamics graph, which we recommend using during consultation.
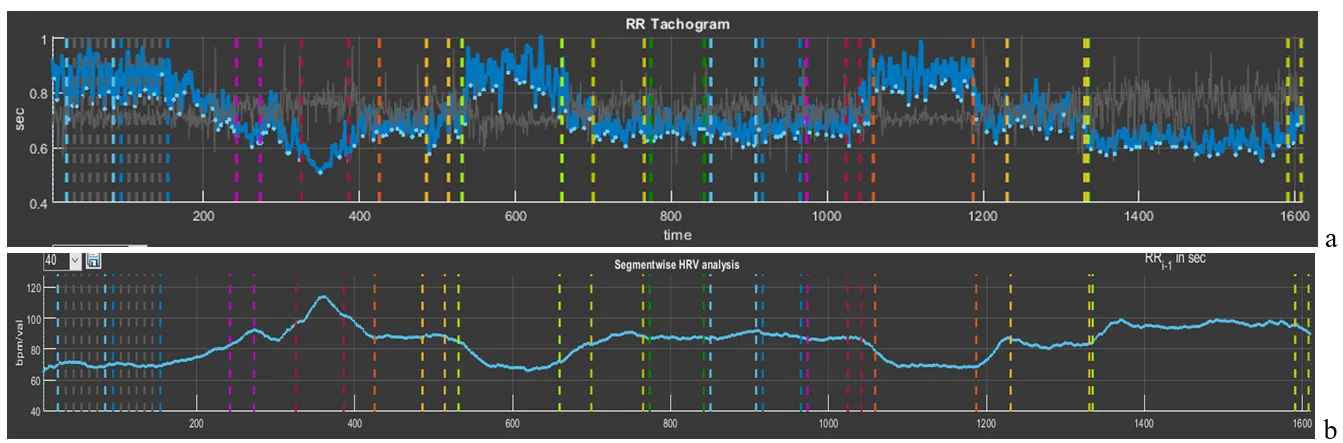
Figure 3.10. Interdependence of the graphs of Sector 5 and Sector 8 if heart rate values are displayed on the latter
To display the relaxation dynamics graph as shown in Fig. 3.9, a number of manipulations should be performed, which are described in Chapter 2 in the corresponding advisory section: reset all graphs, activate the “Relaxation” graph, scale vertically, and smooth (if necessary) by the number of averaged points of the recorded primary data (in our example, 40 points).
We have prepared the “Cardio domain” page, opened the report, and are now ready for consultation.