The first thing that should be paid attention to is the quality of the obtained recording. Figures 3.1, 3.3, and 3.8 present three variants of recording primary data related to the ECG. Let us analyze them.
Figure 3.1 is familiar to you, since the text of Chapter 2 of this manual is built on its example. Therefore, we hope it does not require lengthy explanations. Let us focus only on several points: 1) the need to display the ECG curve in Sector 4 (Fig. 3.1b); 2) pay attention to the shape of the CIG (Sector 5) and to the shape of the scatter-plot clouds outlined by ovals (Sector 7).
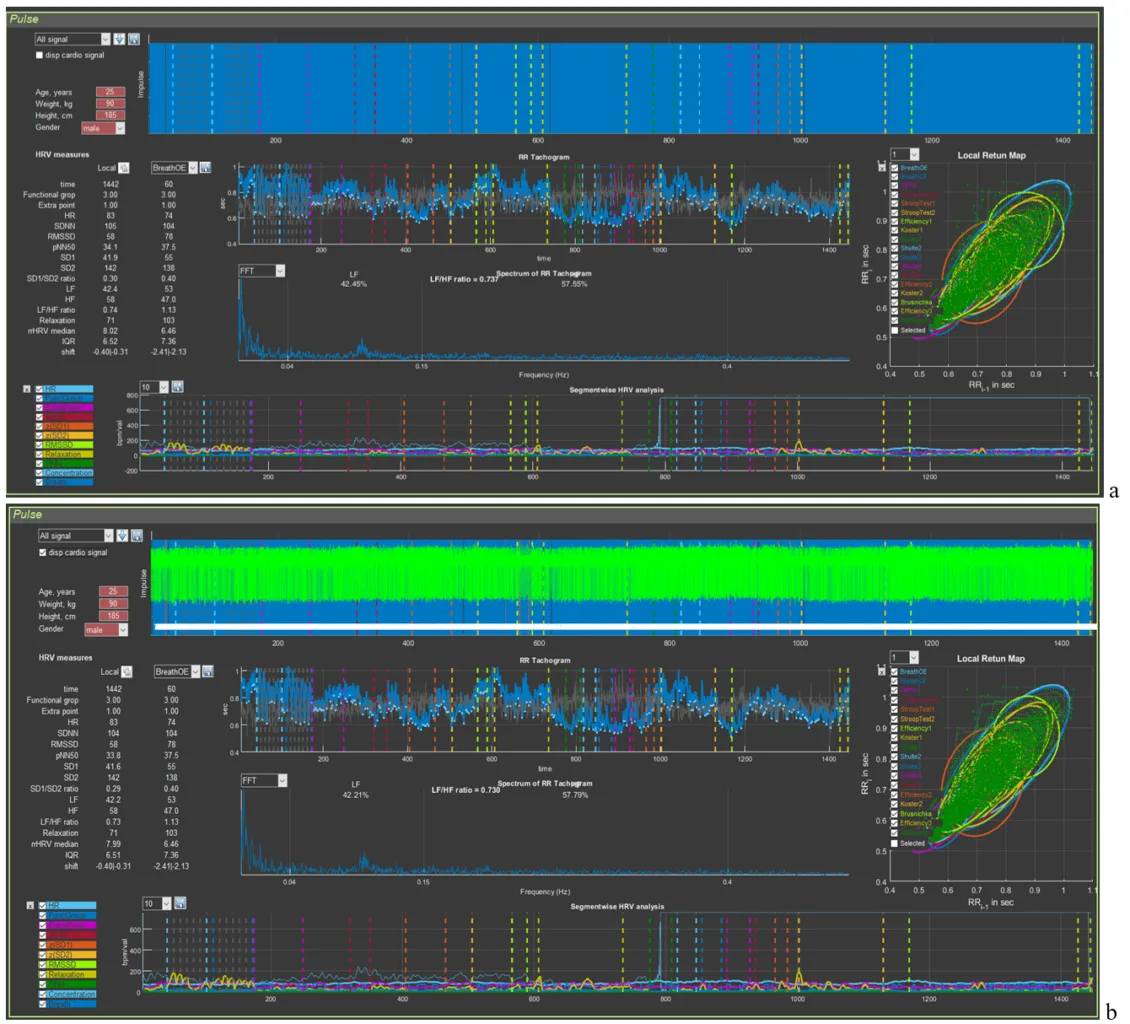
Figure 3.1. Example of a high-quality recording (see explanations in the text)
A high-quality recorded ECG in Sector 4 looks like an even palisade. But if the blue background (Fig. 3.1a) of merged lines (we remind you: this is the vertical line marking the detection of the R wave) does not always make it possible to see an ECG complex that has dropped out of the calculation, then the actual ECG curve will not let you make a mistake (an illustrative example in Fig. 3.3).
To understand the information about the respondent contained in the CIG, let us recall Fig. 2.18, which we will supplement for clarity with arrows indicating transient processes.
We remind you that the shorter the RR interval, the higher the heart rate, and vice versa (see the values on the vertical scale: 1 s corresponds to 60 beats/min, 0.4 s to 150 beats/min).
The first thing to pay attention to is the slow-breathing stages at the beginning of the study. This trial pursues several goals: 1) breathing at a rate of about 6 respiratory movements per minute allows a person to adapt to VR conditions and thereby standardize the conditions for everyone when performing subsequent tests in Stressonika. In Fig. 3.2b it can be seen that the HRV amplitude in this test is the largest (the height of the bidirectional vertical arrow); 2) breathing at a rate of about 6 respiratory movements per minute triggers processes of maximum “swinging” of HRV due to activation of the parasympathetic nervous system and, according to one of the approaches to breathing practices, to resonant interaction between the respiratory center and the center controlling the activity of the cardiovascular system in the CNS. This trial makes it possible to see the respondent’s response to such breathing and, consequently, the possibility of recommending to them resonant breathing practice in order to increase parasympathetic tone in situations of emotional tension.
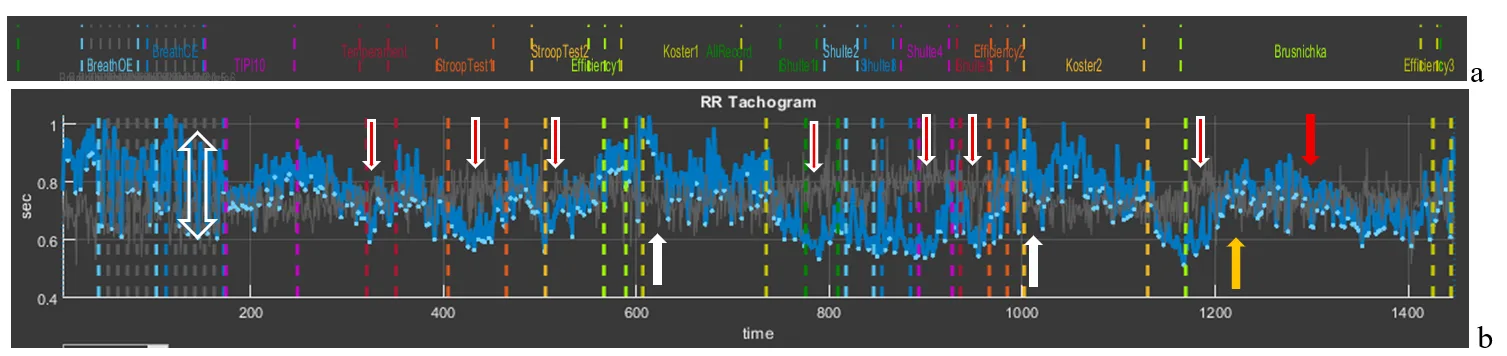
Figure 3.2. Cardiointervalogram for the entire study period (see explanations in the text)
The second observation is fluctuations in RR interval duration that are clearly dependent on the beginning of the testing stages: the vertical red arrows with a white outline directed downward indicate a shortening of the RR interval (and therefore an increase in HR) at the beginning of each test with cognitive load. However, during the 2-minute rest stages (white arrows directed upward), the RR interval duration increases (this is manifested by a decrease in HR). It can be assumed that the beginning of the load tests is stress-inducing for the respondent, but at the same time they are not yet in a state of chronic stress, since, in response to the request to rest during the corresponding testing stages, the body responds adequately by lowering HR. Such a type of response to tests may also indicate the respondent’s emotionality or their involvement in the testing process.
The third observation is the response to the final test, in which cognitive load is combined with a time limit. The respondent’s first reaction is typical for them: at the beginning, HR increases, then decreases (yellow arrow) and the functional state stabilizes for some time, and then (red arrow) HR begins to increase again. This dynamics most likely indicates fatigue. If the productivity of cognitive activity did not decrease by the end of this test, then such a report indicator as the “Volitional Effort Indicator” will be at a sufficiently high level, and vice versa. In this way, the value of the “Volitional Effort Indicator” can be illustrated to the person being consulted using the example of their autonomic response and, consequently, useful recommendations on self-regulation in certain life and professional situations can be given.
We hope that these explanations have shown the benefit of considering the CIG in the format of the entire test. Let us take them as a model for further examples.
Figure 3.3 presents an example of permissible defects in an ECG recording. Obvious “gaps” between the blue vertical lines (Fig. 3.3a), highlighted by white and yellow ovals, immediately catch the eye. In Sector 5, within this time interval, it can be seen that the CIG structure is disrupted: under the white oval a rather long straight segment is visible, indicating that part of the consecutive ECG complexes were not taken to build the cardiointervalogram curve; under the yellow oval the CIG clearly differs from the general background. If the ECG is additionally visualized in Sector 4 (Fig. 3.3b), other recording defects can also be noticed (highlighted by the red oval). Let us consider these segments in more detail.

Figure 3.3. Example of an acceptable recording (see explanations in the text)
Let us remember the “Zoom In” icon and select the segments marked by the white oval first in Sector 4 and then in Sector 5 (Fig. 3.4). In this time interval, prolonged artifact segments are observed on the ECG (probably related to motor activity), against which identification of the R wave is impossible (the longest ones are marked by horizontal bidirectional arrows). On the CIG, this “failure” in the ECG recording forms a straight segment that connects the recorded RR interval before the artifact begins and the first recorded interval after it (Fig. 3.4). After the longest artifact segment of the ECG recording, other, shorter bursts of artifact activity are also visible, which we hope you can already see on your own.
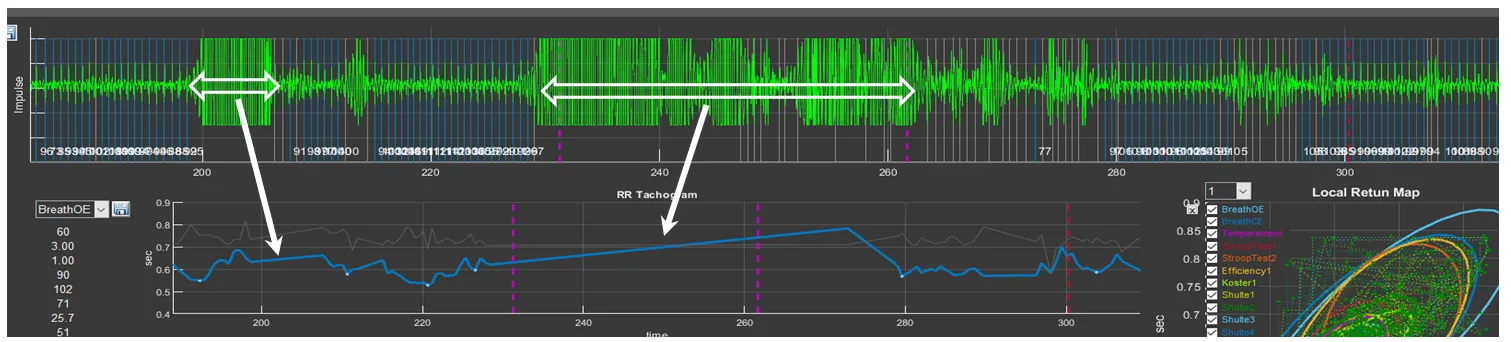
Figure 3.4. Example of a prolonged artifact ECG recording
Press the “Restore View” button in Sectors 4 and 5 to restore the initial view of the curves, and then select the segments under the yellow oval (Fig. 3.5). Consecutive short-term artifacts of the ECG recording are visible. In such cases, on the overall CIG curve they look like high-amplitude pointed waves that differ from the general background. When this segment is selected on the CIG curve, short straight segments (indicated by the arrow) can be seen, which are not characteristic of a cardiointervalogram (Fig. 3.5).
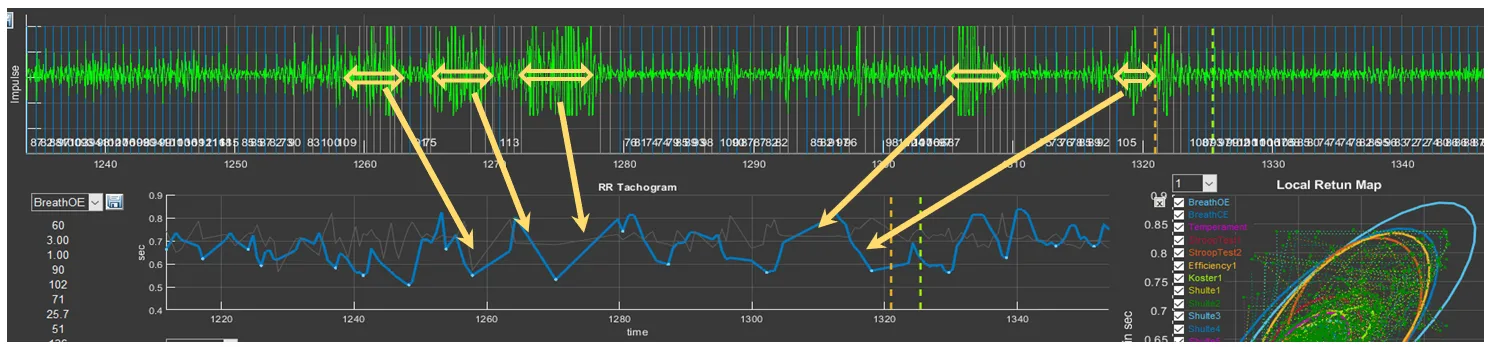
Figure 3.5. Example of an ECG recording with consecutive short-term artifacts
It remains to see what “problems” are present in the ECG recording under the red ovals (Fig. 3.6). Select them and you will see the already familiar picture, with the only difference that the artifacts are brief. Such artifacts, as we hope you have convinced yourself, are better seen when the ECG is activated in Sector 4.
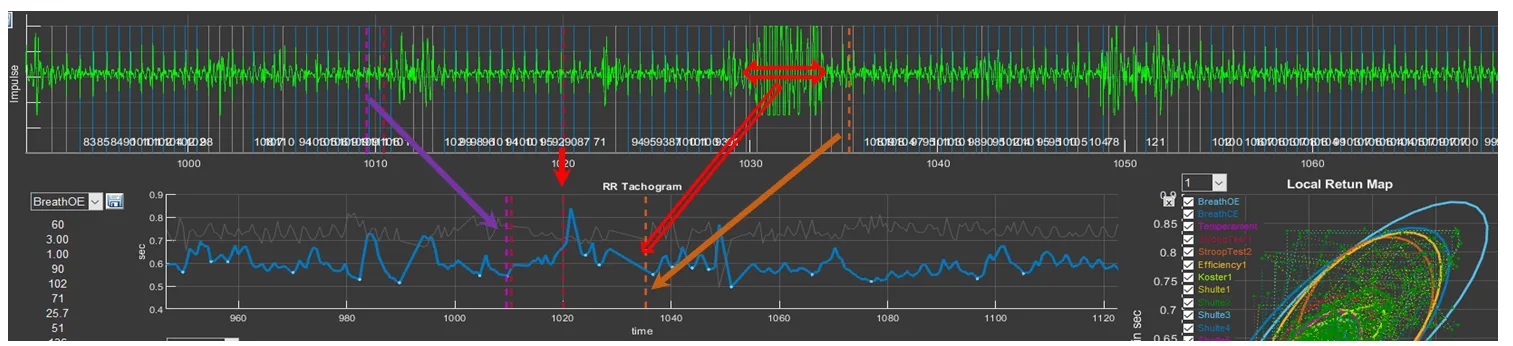
Figure 3.6. Example of an ECG recording with consecutive brief artifacts
We remind you of the colored dashed vertical lines that separate the testing stages. You can use them to orient yourself as to which segment of the biological-signal recording you are in (see the arrows in Fig. 3.6).
Let us answer the question: why is such a recording suitable for analysis and full consultation based on the report? For this, let us refer to Fig. 3.7 (for convenience of perception, in the top line we place a part of the “Time domain” window where the names of the study stages are indicated). Please note that artifact segments are located in zones that are not included in the analysis of the respondent’s psychoemotional state assessment, or when these zones are not critical for holistic perception of the study results: the white oval outlines the stage of becoming familiar with the techniques of controlling the controller in VR; the red oval outlines the period of self-assessment of the effectiveness of performing the Schulte tables; the yellow oval outlines the training stage before testing the last task.
Short-term single artifacts will also not affect the overall result, since the statistical processing covers a sufficiently large volume of data required to calculate a given indicator and to produce generalized conclusions.
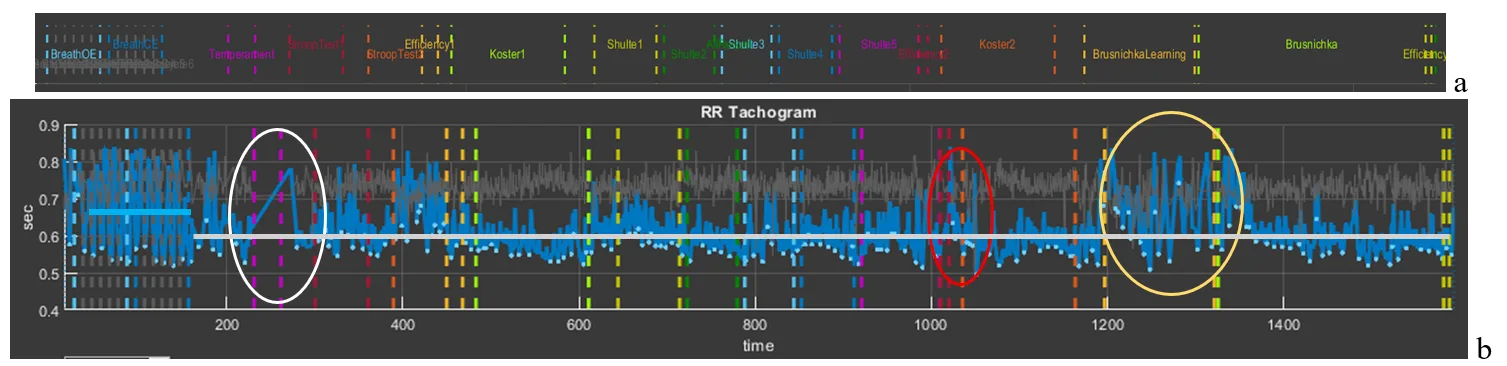
Figure 3.7. CIG for the entire study period acceptable for analysis (see explanations in the text)
If we have decided that the artifacts of the ECG recording are not critical for the overall analysis, let us compare Figs. 3.2 and 3.7. It is striking that the CIG curve in Fig. 3.7 practically lies on one line (highlighted by the gray segment). The RR interval level is determined by the value of 0.6 s or, converted to HR, 100 bpm (tachycardia). At the same time, both during test performance and during rest periods, HR did not change noticeably; i.e., throughout the entire testing period the respondent was in a state of stress. Even during the controlled slow-breathing stage, HR was about 90 bpm (the blue segment illustrating the average RR interval value at this stage), although it can be seen that the CIG range is from 0.55 to 0.82 s, which indicates preservation of the interaction between the centers controlling external respiration and the cardiovascular system, as well as reflex systems determining the tone of these centers.
The shape of the cardiointervalogram (CIG) curves is individual.
It is practically impossible to encounter two identical reactions to Stressonika. With sufficiently extensive observational experience, it is possible to identify some common features in certain groups of people. However, each time you comment on an individual’s raw data, you should proceed from the person—their reaction to the testing (before, during, and after), behavior, communication with you, the raw data in CleverView, the report, and some other details and nuances.
Now an example of a recording unsuitable for assessing the respondent’s psychoemotional state (Fig. 3.8). Upon the initial loading of the person’s file it can be seen that the automatic search for the R wave on the ECG “encounters serious problems”. The palisade of blue lines does not fill the entire space of Sector 4; over the entire recording period, the time of detected R waves (blue color) does not overwhelmingly prevail compared to missed ones (background color) (Fig. 3.8a). Displaying the ECG curve on the screen (Fig. 3.8b) only emphasizes this observation. Zones where registration of the R wave is impossible (intervals filled with artifacts) are present at almost all key stages of testing.
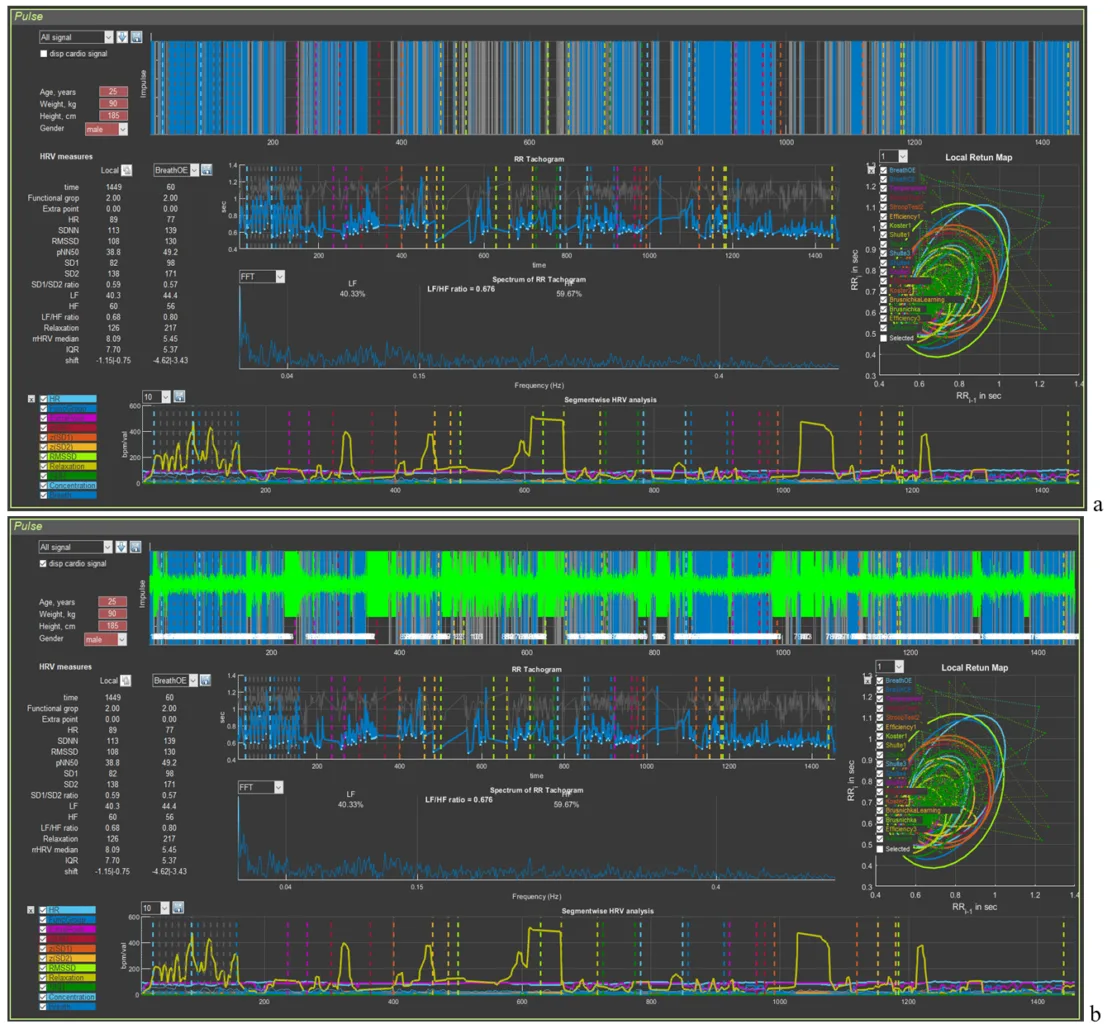
Figure 3.8. Example of a recording unsuitable for analysis of the psychoemotional state (see explanations in the text)
Can the report be commented on in such cases? It can, but only for such sections as: perception, attention, executive functions, efficiency, and properties of the nervous system. That is, for those indicators in which the autonomic response of the person to cognitive stress is not taken into account. But this part of the Stressonika approach is the most important! Therefore, in red letters:
Before starting the testing recording in Stressonika, make sure that the ECG curve is registered with quality!