Sector 3 is a table with HRV data for the study period activated in sector 4, and selectively by stages for comparison. This sector also includes the ability to save HRV data as a separate file in Excel.
We have already become acquainted with the table itself (see Fig. 2.6). Now let us consider it in more detail. Something will have to be repeated, something reminded.
The table itself is labeled “HRV measure” (HRV – Heart Rate Variability) and consists of 3 columns: the 1st contains a list of HRV measures; the 2nd – “Locale” – contains the measures corresponding to the first column for the study period that is displayed in sector 4 (when we load the required file, sector 4 displays the ECG for the entire study period (Fig. 2.8a). If in sector 1 we select one of the stages, then in this column the HRV data of the stage we selected, displayed in sector 4, will be shown (Fig. 2.6a)); the 3rd, as its title, contains a window with an arrow, clicking on which opens another window with a list of the stages of the study passed by the respondent (Fig. 2.8b). Earlier we selected the “BreathOE” stage (Fig. 2.6b).
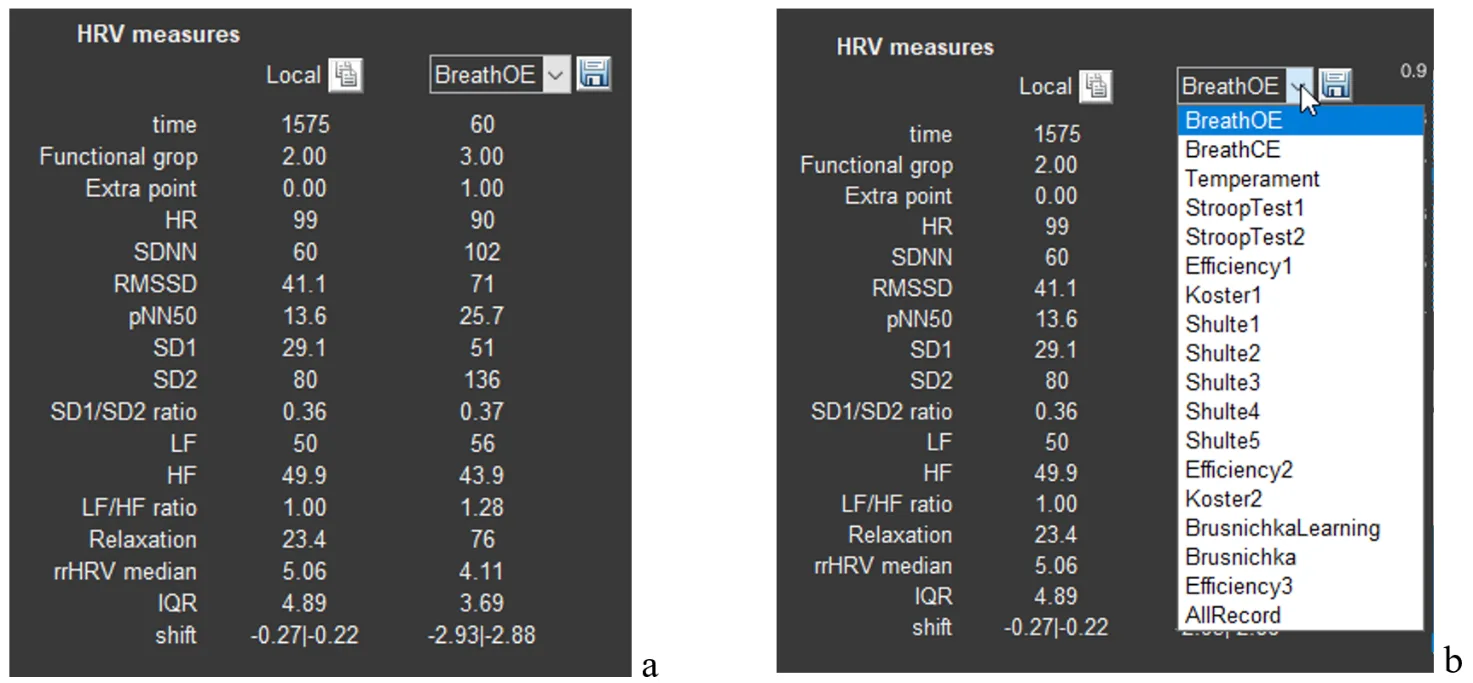
Figure 2.8. a – HRV data after activating the respondent’s file; b – selection of a stage for displaying HRV data in the second column of the table.
Now let us save the HRV data (Fig. 2.9). Move the cursor to the “button” with the floppy disk icon (Fig. 2.9a). Click, and you are prompted to save the data in the person’s folder in the “SAVED DATA” directory in a file whose name is the name of the main file with “_calcPulse” added (Fig. 2.9c). The saved file can be opened in Excel; the main sheet is illustrated in Fig. 2.9d.
Please note: in Fig. 2.9d, the anthropometric data are those that we entered manually. Let us repeat: if Sector 2 is colored red, then the data specified in it do not correspond to the person whose file is open in CleverView, and, consequently, some calculated data will not correspond to the individual’s age and sex.
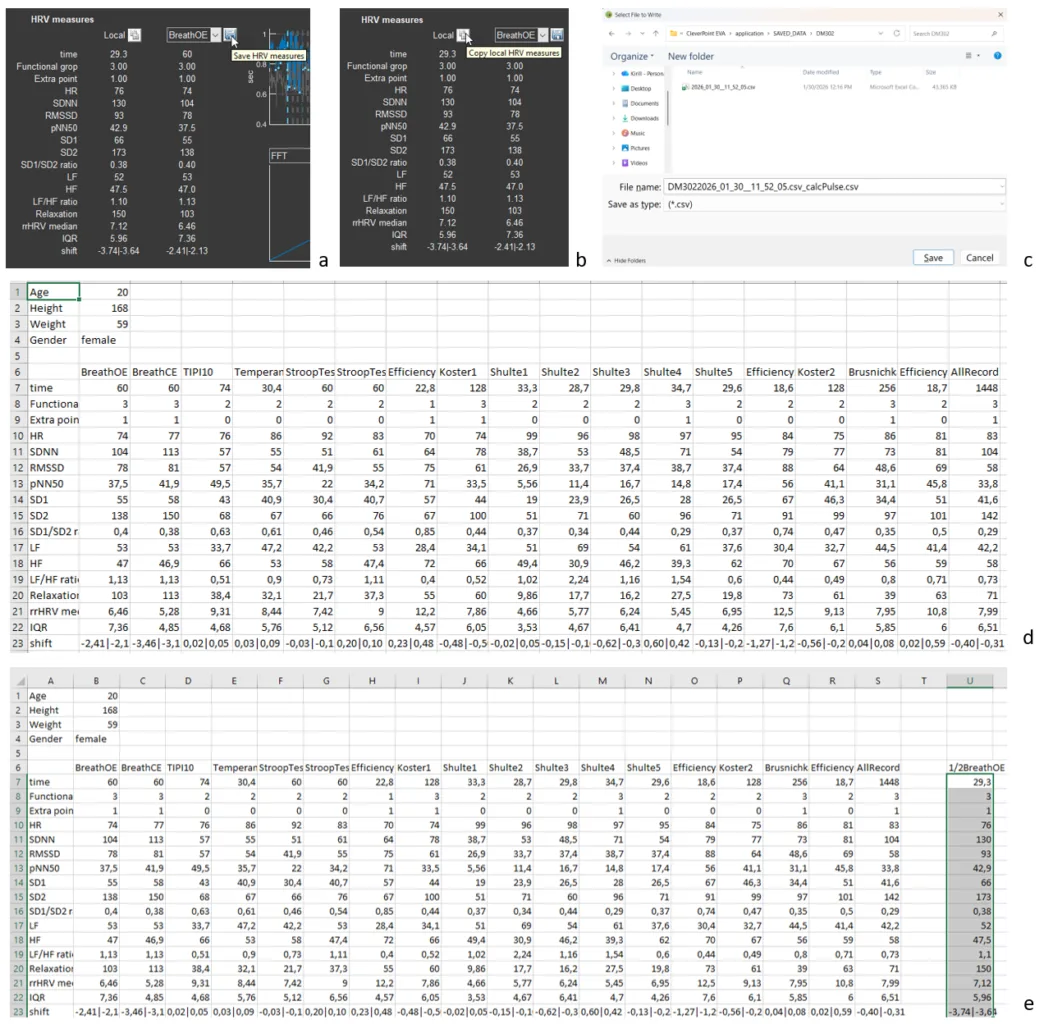
Figure 2.9. Saving HRV data (explanations in the text)
If you remember, when we analyzed sector 1, we were “interested” in what the respondent’s HRV response was at the beginning of the test with slow controlled breathing with open eyes (Figs. 2.5 and 2.6b). The data in the “Local” column are non-standard and are not included in the saved file with HRV data (Fig. 2.9d). However, if they are of interest to you and are needed for any purposes, you can save them by pressing the functional button (standard for such purposes) next to the text “Local” (Fig. 2.9b). The data of this column will be loaded into the clipboard, and you can save them, for example, in the file created by CleverView in a separate column. In our example, we called it “1/2BreathOE” (Fig. 2.9e).
Separately, as briefly as possible, we will dwell on heart rate variability measures (Table 1).
We recommend that you familiarize yourself with this part of the manual, as this will give you a certain confidence in interpreting the data both during consulting and during the analysis of the work you have performed. Knowledge is never superfluous!
The duration from one heart contraction to the next is not the same. This is clearly seen in the ECG example we recorded in sector 4, and visually, but more convincingly, this is confirmed by the numbers next to each vertical blue line (Fig. 2.10). These numbers reflect the value of the instantaneous heart rate (HR), which is calculated over the length of one interval between R waves of successive ECG complexes: 88, 94, 93, 84, 62, 60 beats/min (the classic labeling of the ECG complex waves is shown on the fourth ECG complex window from the beginning). This non-uniformity of the duration between heart contractions is called heart rate variability (HRV).
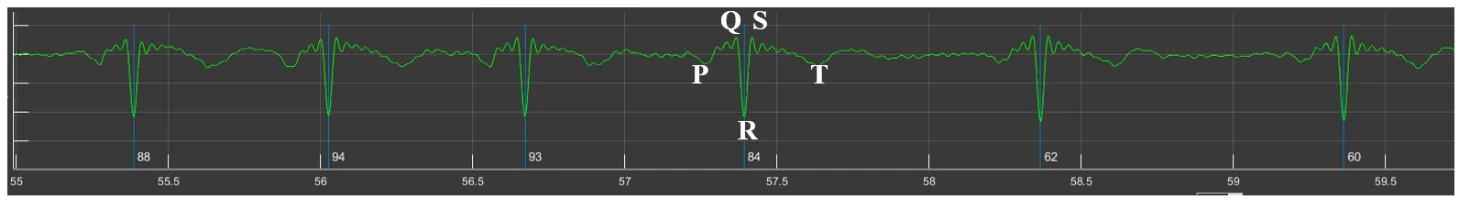
Figure 2.10. Example of heart rate variability
Reminder: (1) In our ECG graphs, the ECG is presented in an inverted form; (2) The main purpose of displaying the ECG in Sector 4 is to enable visualization of the correctness of the automatic detection of the R wave, which is marked by a vertical blue line.
In addition: (1) In Sector 4, you can see premature heart contractions—extrasystoles (they are marked by a red vertical line). According to the rules of HRV analysis, extrasystoles are not included in the mathematical analysis, but their visualization is sometimes important for assessing cardiac rhythm disturbances; (2) In the case of interference superimposed on the ECG, it is possible to identify the reason for the “exclusion” of ECG segments from the calculations.
HRV analysis in CleverView is based on measuring intervals between R waves on the ECG and constructing a cardiointervalogram – a graphical representation of the durations of successive RR intervals (see the graph in sector 5, where the horizontal axis shows the time of the ECG recording, and the vertical axis shows the duration of the RR interval). Then the RR-interval data are processed using various mathematical methods. What does heart rate variability depend on? First of all, on the tone of the systems responsible for regulating the pumping function of the heart, and above all on the functional state of the autonomic nervous system. The autonomic nervous system consists of two subsystems that perform different functions in the body: the sympathetic nervous system and the parasympathetic nervous system. In the most simplified terms: the sympathetic nervous system maintains the functioning of the body in a stressful situation, and the parasympathetic system supports recovery processes after stress.
Some HRV analysis methods are based on measuring the pulse wave. However, HRV data based specifically on measuring RR intervals are considered the most accurate.
There are many mathematical approaches to processing RR intervals and assessing HRV. Measures from some of them are used in CleverView. These are the ones displayed in the table of sector 3. You can see the interpretation of these measures in Table 1.
Table 1. Sector 3 measures, their definition and physiological role.
| HRV measure | Units | Name | Physiological significance |
| time | s (sec.) | Duration of the analyzed ECG segment for which the HRV data are given below. | |
| Functional grop | – | Functional group. | See the “Report manual”. |
| Extra point | – | Number of adjustment criteria that were taken into account when determining the functional group. | |
| HR | beats/min | Heart rate (average over the observation period). | Reflects the level of functioning of the circulatory system. |
| SDNN | ms | Standard deviation of the mean duration of the cardiac cycle. | Measure of the power of high-, low- and ultra-low-frequency influences on short recordings, and of the entire spectrum of neurohumoral influences on long recordings. |
| RMSSD | ms | Root mean square of successive RR-interval differences. | Measure of the power of high-frequency neurohumoral influences; it is often identified with the activity of the parasympathetic link of the autonomic nervous system. |
| pNN50 | % | Number of successive pairs of RR intervals differing by more than 50 ms, divided by the total number of all RR intervals. | Measure of the ratio of the powers of high-frequency and low- frequency neurohumoral influences; it is often identified with the ratio of the activity of the parasympathetic and sympathetic links of the autonomic nervous system. |
| SD1 | ms | Width of the cloud on the Poincare plot (see sector 7). | Reflects instantaneous changes in RR-interval duration associated with the activity of the parasympathetic division of the autonomic nervous system. |
| SD2 | ms | Length of the cloud on the Poincare plot (see sector 7). | Displays long-term heart rate variability. SD2 is a measure of the slower component of heart rate variability. |
| SD1/SD2 | – | Ratio of the cloud width to its length, SD1/SD2. | Measure of the balance between instantaneous and long-term heart rate variability. |
| LF | ms² | Power of the mid-frequency component of the overall HRV spectrum (see sector 6). | Measure of the power of low-frequency influences of neurohumoral regulation; it is associated mainly with the sympathetic and partly with the parasympathetic links of regulation. |
| HF | ms² | Power of the high-frequency component of the overall HRV spectrum (see sector 6). | Measure of the power of high-frequency influences of neurohumoral regulation; it is associated mainly with the parasympathetic link of regulation. |
| LF/HF | – | Balance of the slow and fast components of the overall HRV spectrum (see sector 6). | Measure of the balance between low- and high-frequency regulatory components; it is often considered as a measure of sympathovagal balance. |
| Relaxation | – | Severity of the resting state. | |
| rrHRV median | |||
| IQR | Interquartile range used to quantify the spread of cardiointerval values. | Helps to understand how stable HRV indicators are by indicating the spread of the central part of the value distribution. | |
| shift | |||
We caution you against a mechanical interpretation of HRV data and categorical conclusions! HRV is a vast body of scientific views, approaches, and conclusions. The results and their interpretation depend on many nuances, some of which have been taken into account by the CleverView developers, but many still require scientific consideration. The researcher’s personal experience is also important—their accumulated data and the set of individuals associated with them, with whom they have worked.
In addition, the analysis in CleverView is based on short ECG recordings, which dictates the need for a more cautious approach to the evaluation of HRV results that are traditionally based on data from long-term recordings.
We recommend that you take an additional interest in HRV. Popular-science texts are suitable for more well-founded argumentation during consulting with a respondent. If HRV data are needed for scientific work, then the reading of literature sources should be of a different kind.
Let us move on.