Sector 1 allows: 1) to display the ECG curve in sector 4, 2) to control visualization of the stages of the study, 3) to save RR interval data in Excel, and 4) to recalculate HRV measures on the ECG segment you selected.
Sector. 1.1 #
Let us begin by displaying the ECG curve in sector 4: move the cursor to the “disp cardio signal” window (Fig. 2.2a), put a mark in it (Fig. 2.2b), wait a little (remembering the red-colored line with the name of the activated file), and obtain the green ECG curve (Fig. 2.2c).
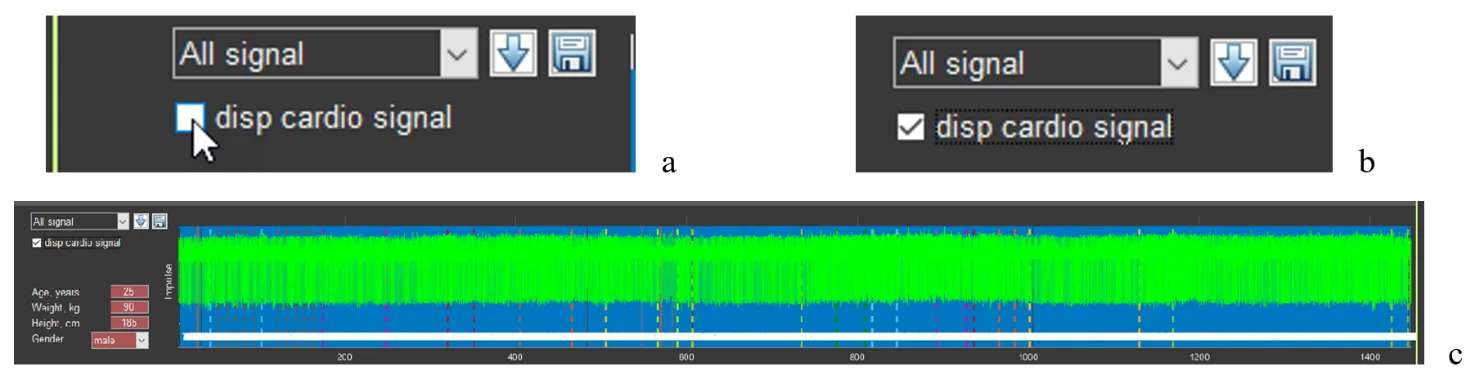
Figure 2.2. Sequence of actions to activate the ECG curve
In the window for controlling the visualization of the stages of the study, “All signal” is selected (Fig. 2.2a,b), which means that in sector 4 the ECG complexes will be displayed over the markers of the found R waves for the entire examination time. If another stage is activated, then the picture in sector 4 will be different (see below).
If you load the file of another person with the “disp cardio signal” window activated, the ECG will load, but already under the markers of the found R waves. This will not prevent you from working with the ECG at individual stages. But if it is more convenient for you to see the ECG as shown in Fig. 2.2c, we recommend first removing the check mark in the “disp cardio signal” window and then activating it again.
Sector. 1.2 #
Control of the visualization of the stages of the study is shown in Figure 2.3.
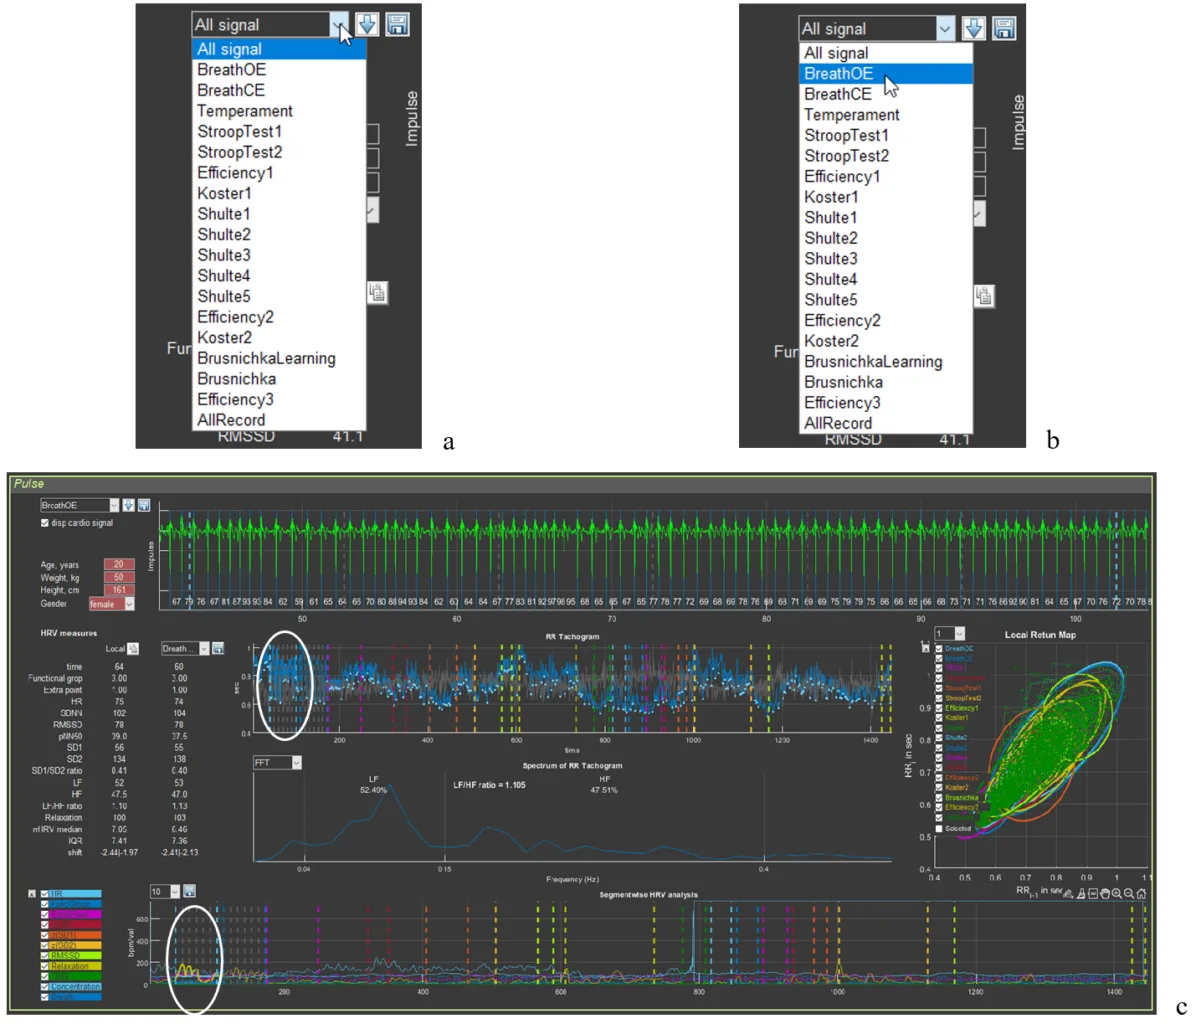
Figure 2.3. Sequence of actions for visualizing the stages of the study (explanations in the text)
Move the cursor to the “button” for activating the list of stages of the study (Fig. 2.3a), select the stage you need (in our example, this is slow breathing with open eyes – BreathOE) (Fig. 2.3b), click on the stage name, and wait; the resulting outcome is shown in Fig. 2.3c. Pay attention to sectors 3, 4, 5, 6, and 8.
In sector 3 under the “Local” label, the numbers corresponding to the HRV measures written in the first column will correspond to the duration of the ECG curve placed in the sector 4 window.
In sector 4, only the ECG segment corresponding to the BreathOE stage is presented (between the vertical dashed lines of the color corresponding to the stage at the beginning and at the end of the sector window). We note immediately that the ECG is positioned with the R wave downward; the blue lines are the R waves detected by the program. When “All signal” is activated, they produce that blue background of the sector (Fig. 2.1), provided that practically all R waves are recorded.
In Fig. 2.3c, all R waves at the BreathOE stage are “found” by the program correctly. Examples when this is not the case, and what the corresponding sectors look like then, will be provided in accordance with the logic of the manual. We will also give advice on how to correctly interpret such cases.
In sectors 5 and 8, the BreathOE stage is highlighted on the curves with a thicker line (we have highlighted it with a white oval).
In sector 6, a spectrogram is presented that reflects the dynamics of changes in RR intervals during the period of slow breathing with open eyes – BreathOE.
We recommend that, before moving on to the next part of the manual, you activate other testing stages in Stressonika (see Fig. 2.3a) and observe the changes on the screen.
Sector. 1.3 #
If you work only as a consultant or your area of interest does not concern scientific methods for processing raw data, then this function may not interest you at some stage.
But why not know that such a function exists?
The ability to work with digitized raw data is important primarily for scientific work, which in the future involves using programs with statistical processing capabilities. And here it is important to know which symbol after the integer value is used to separate fractional values. This is because some statistical programs “work” with a dot, some with a comma. Therefore, before becoming acquainted with the possibility of saving RR interval data, let us turn to the “Option” window on the top panel (Fig. 1.2a). Only now do we activate the “Decimal separator” line (Fig. 2.3a). It is clear that this window allows you to choose the symbol with which the digitized raw data will be saved.
Choose the one you need and click on it.
If saving digitized raw data is mandatory in your work, we recommend that immediately after opening the CleverView program you specify the symbol you need in “Decimal separator” (Fig. 2.3a). And only after that begin working in the program itself.
Next, we turn to sector 1 to the “button” with the floppy disk image – a classic sign of saving something (Fig. 2.3b). This action will prompt you to save RR interval data in a file with the “csv” extension to the same folder that was created in “SAVED DATA” for a particular person.
The file with the saved RR interval data, expressed in seconds, opens in Excel (Fig. 2.3c). RR intervals are sequentially located in named columns: for the entire study period (All) and for each stage separately.
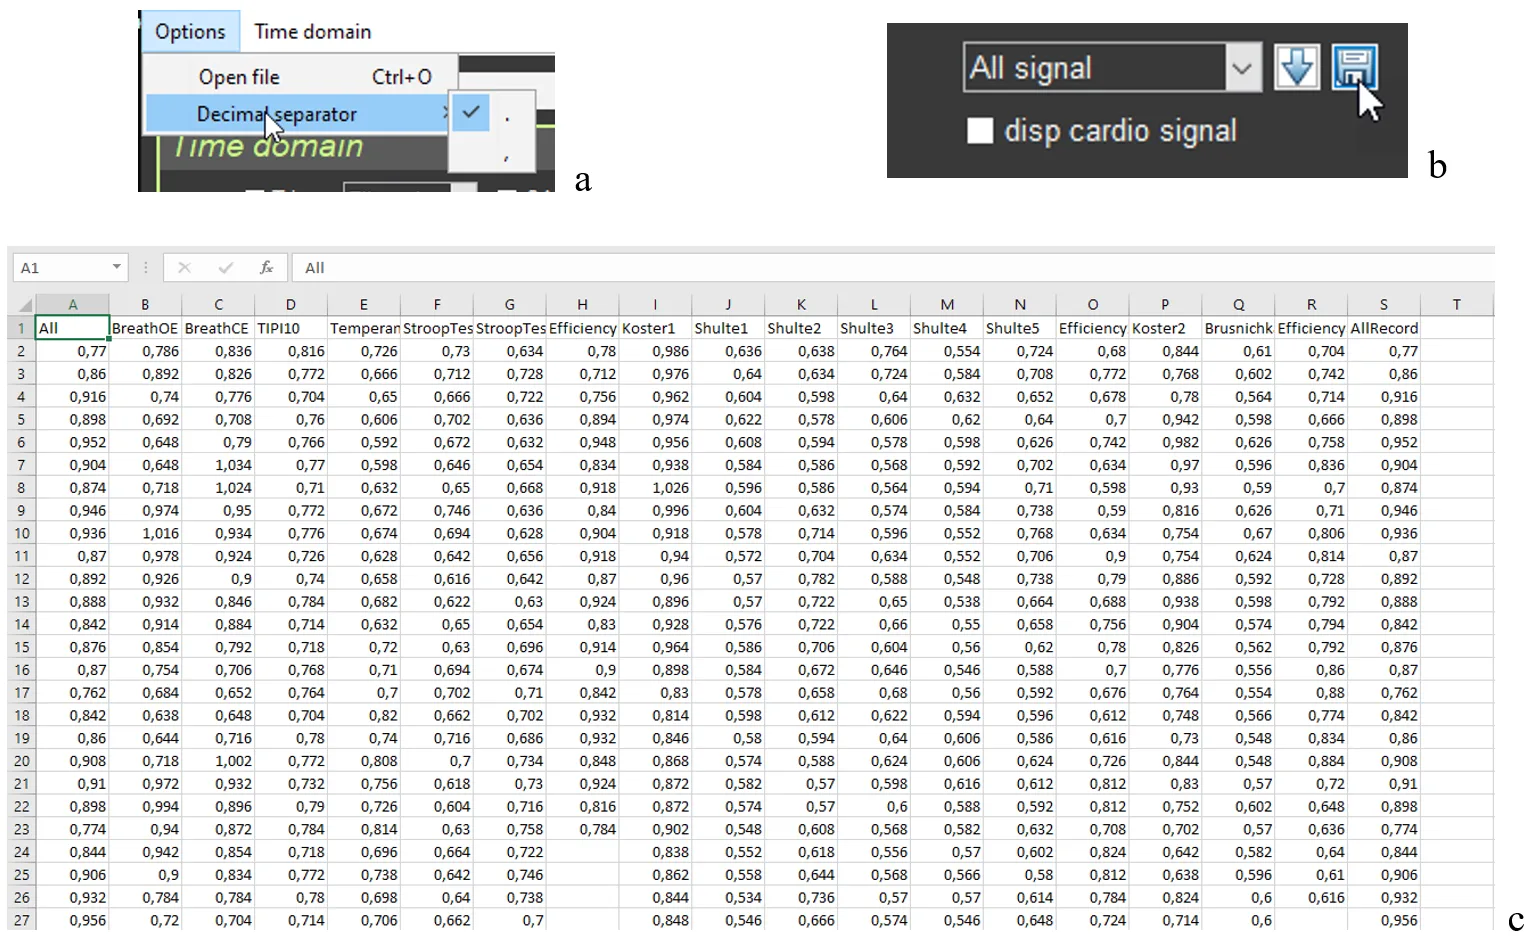
Figure 2.3. Sequence of actions for saving RR interval data (explanations in the text)
We will not give you advice on how to work with digitized raw data. This is a matter of individual practices, habits, and skills of working with auxiliary programs. How and where to store such files you will determine yourself, if you need it.
Sector. 1.4 #
It is impossible to describe the button with the arrow pointing downward (Fig. 2.4) without references to other sectors and work with functional buttons.
Let us sort it out.
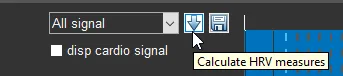
Figure 2.4. Button that allows you to recalculate HRV data for the ECG segment selected by you in the sector.
For this we will have to refer to sector 4 and the ECG segment already displayed by us, which corresponds to the BreathOE stage (Fig. 2.5a). We immediately draw your attention that the duration of the BreathOE stage is visualized in the sector window from one vertical dashed blue line to another, but the window includes a somewhat larger segment. It is precisely the HRV data for the entire window that are displayed in sector 3 under the “Local” label, and under the window in which the BreathOE stage is displayed – data only for the time of the stage itself (from one vertical dashed blue line to another). This nuance becomes clear if we refer to the first line “time”: under the “Local” label – 64 seconds; under “BreathOE” – 60 (see Fig. 2.6a).
If you want to know, for example, what the HRV measures were in the first half of the stage, then you must display this time interval in the sector 4 window. We recall the “+” icon in the upper right corner. Move the cursor to this area of the sector 4 window, functional buttons will be activated, press “+” and bring the cursor to the beginning of the stage (the first vertical dashed blue line) already in the form of a small cross, hold down the left mouse button and draw a horizontal line to the place we need (Fig. 2.5b; according to our example, this is the middle of the BreathOE stage; our actions are highlighted with a white oval) and release the mouse button. The result of these manipulations will be reflected in the sector 4 window, namely, displaying the selected time interval of the ECG on it (Fig. 2.5c).
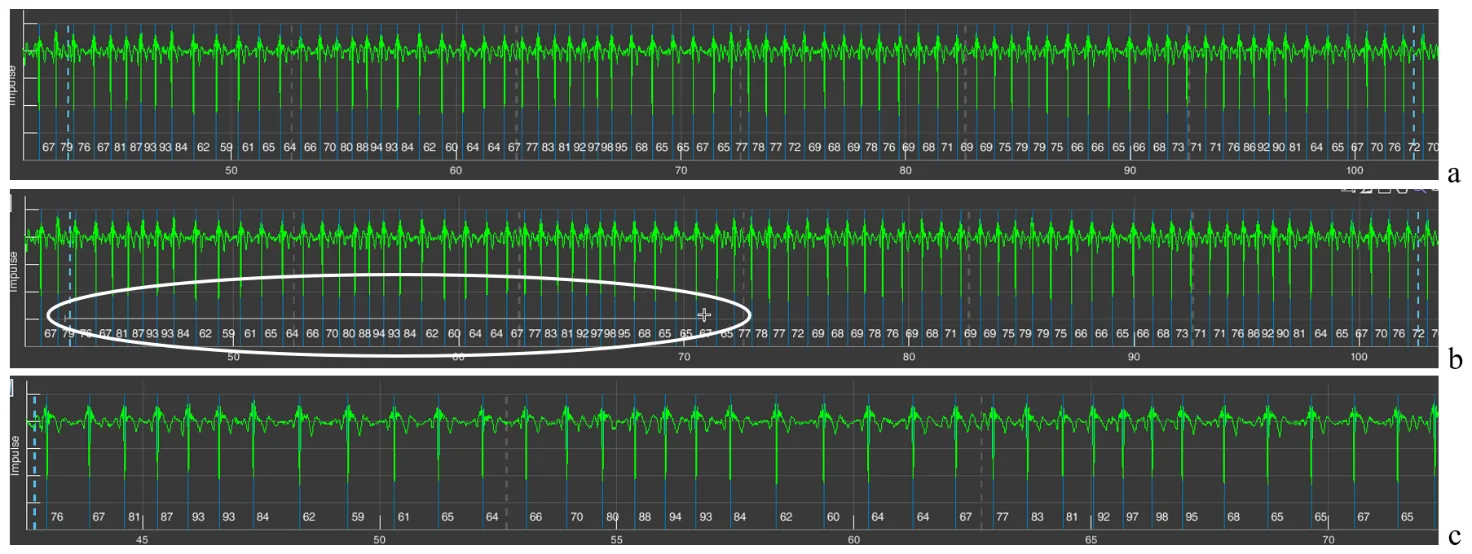
Figure 2.5. Sequence of actions for changing the scale of the ECG curve (explanations in the text)
Let us check. We look at the lowest line that reflects the time of the study (Fig. 2.5a). As we can see, the BreathOE stage lasted between the 40th and the 110th seconds. The time we selected is already between the 40th and the 75th seconds (Fig. 2.5c). We did everything correctly.
Now you can press the arrow button as well. We press it and look at sector 3. If at first, under the “Local” label, HRV data were displayed for the period of 64 sec., which included the BreathOE stage, and under the window in which the BreathOE stage is displayed – data only for the time of the stage itself (Fig. 2.6a), then after pressing the arrow button, under the “Local” label, HRV data appeared for the period that we displayed on the sector 4 screen, and under the window in which the BreathOE stage is displayed, HRV data only for the period of the stage itself were preserved (Fig. 2.6b).
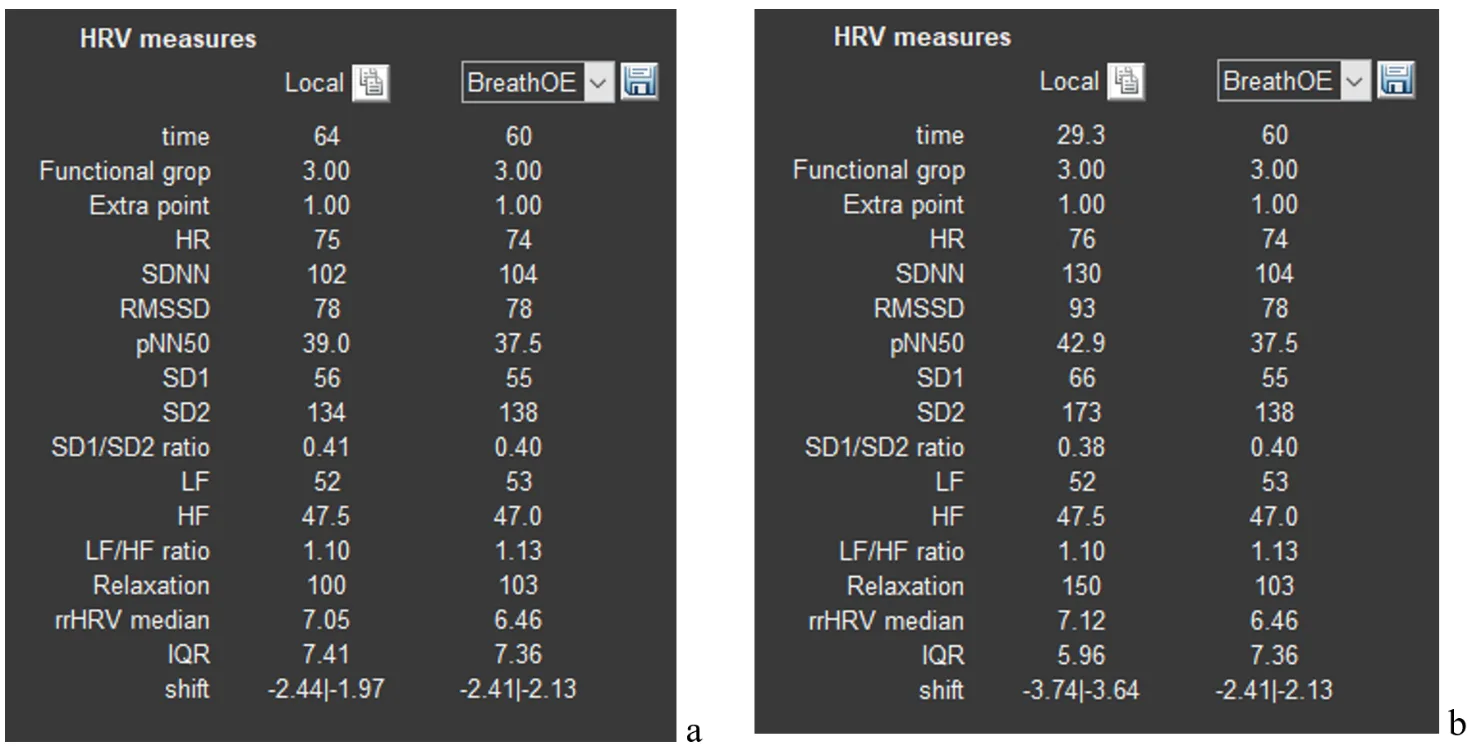
Figure 2.6. a – HRV data after visualizing the BreathOE stage in sector 1; b – HRV data after the time interval of the ECG curve we selected in sector 4.
Changes will also occur in sectors 5, 6, and 8. Which ones? This was described above and shown in Figure 2.3.
We hope that we have sorted out sector 1. We will move on.