Let us begin with the “Cardio domain” page. This page is a visual illustration of the respondent’s general psychophysiological state. When you gain experience and have “looked at” images of this page from different people, you will be able, just by looking at these graphs and numbers, to build your dialogue with the respondent in a reasoned way, emphasizing the report data with objective graphs of a person’s physiological response to one or another task in Stressonika.
If you work with other VR content, the statement about “reasoned construction of dialogue” retains its force. If you do not work as a consultant and your activity is more related to scientific work, viewing this page is also extremely useful for forming preliminary conclusions.
There is another important point that should be highlighted separately: the visual series of this page will immediately indicate to you how well the data collection was carried out (on this page, as we have already indicated, 5 graphs and digital data related to HRV are visualized, which is based on the ECG curve). Examples of poor-quality recordings or recordings with non-critical defects and how to react to this, we will consider below. For now, let us analyze the “Cardio domain” page using the example of a good ECG recording. For the convenience of studying work with this page, we divided it into 8 sectors (Fig. 2.1).
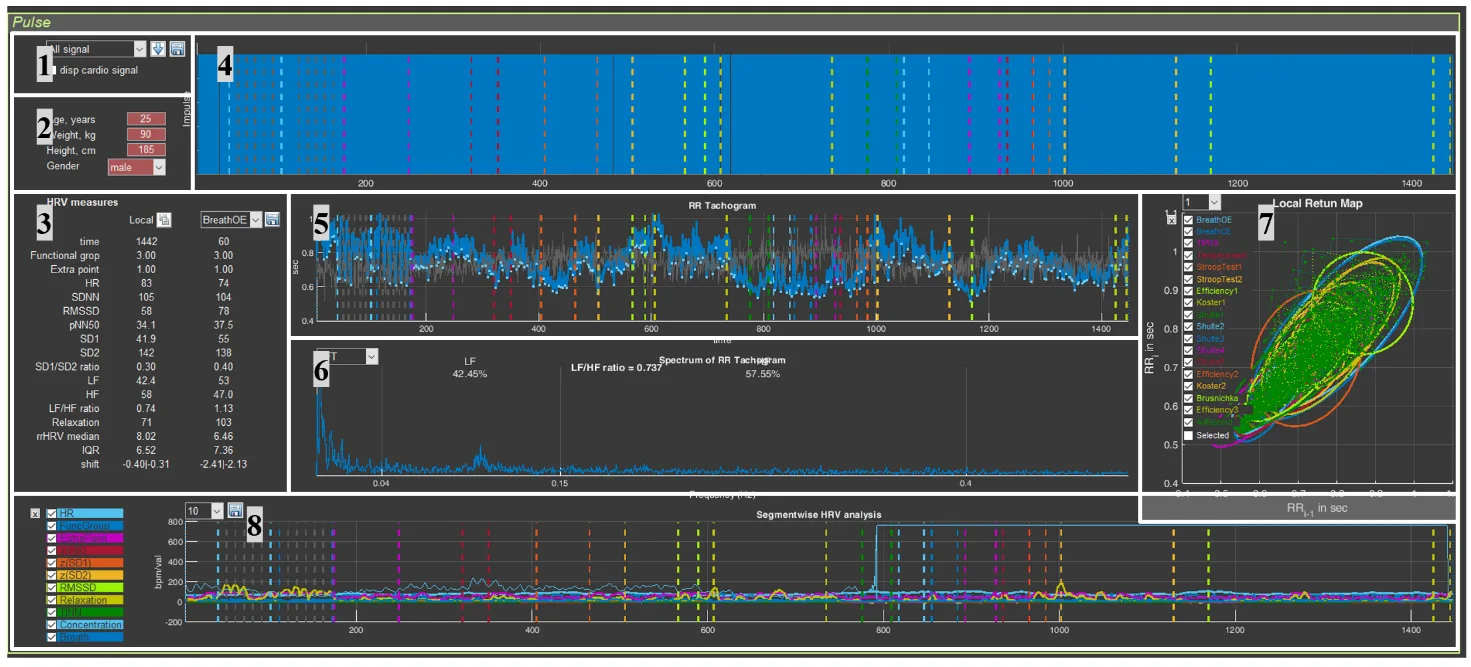
Figure 2.1. “Cardio Domain” page for a loaded file with raw data (explanations in the text)
Highlighting the sectors is an extremely conditional measure, since they are interconnected and changing one can affect another; therefore, the illustration of our actions will be such that you can see these interconnections.
Now, perhaps, we can consider each sector in more detail.