Let us start with general points which you, using our example, can apply in your work, or which you will encounter on any CleverView page.
If you have already clicked on the CleverView shortcut on your desktop, the start page “Time domain” (Fig. 1.1) should already have opened.
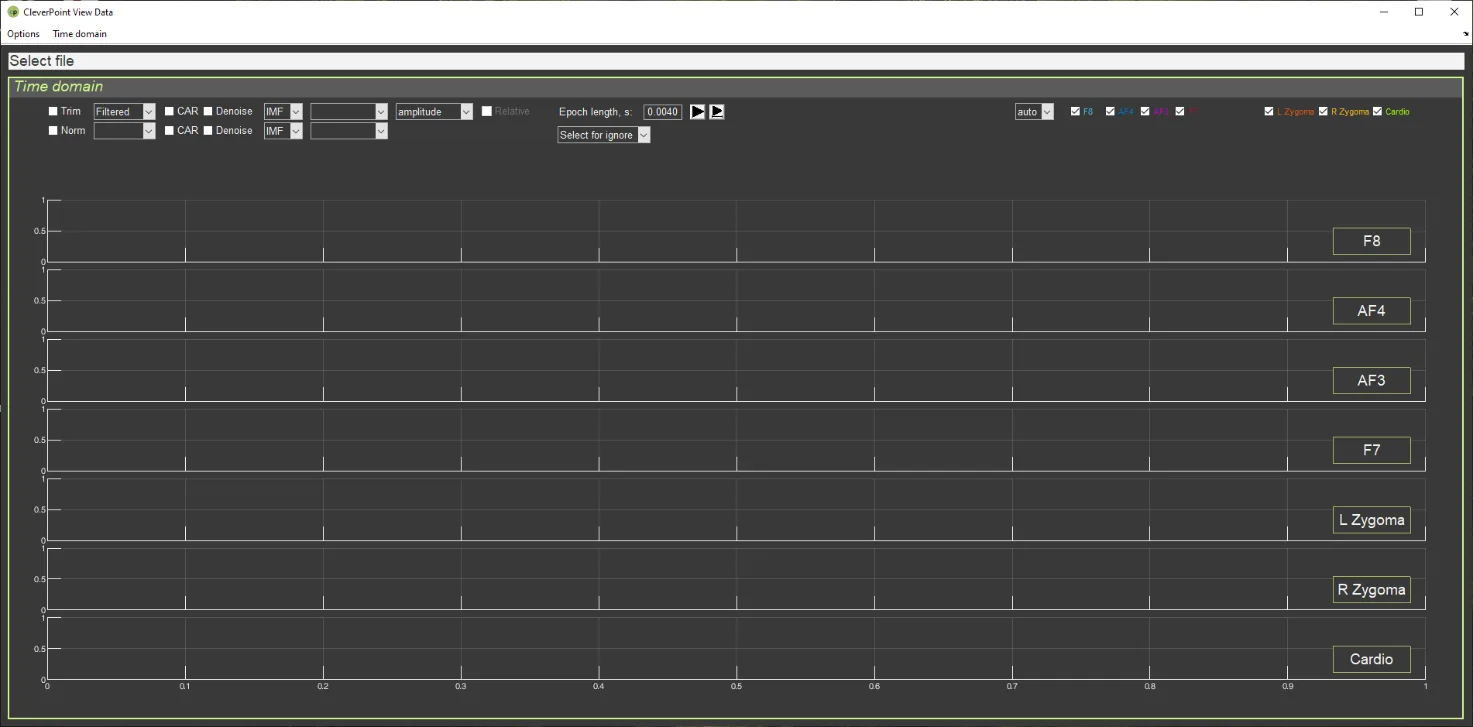
Figure 1.1. CleverView start page.
We recommend studying this manual in parallel with the CleverView program running (active). At first, do this step by step together with the manual; then, as you become familiar with working in the program, selectively, with those chapters that you wish to study additionally.
Now let us load the file with the data of the person who interests you. Click on the “Options” window in the upper left corner of the screen (Fig. 1.2.a), then on “Open file” (Fig. 1.2.b), and you will get to the navigation window, in the “SAVED DATA” folder of which the data of your recordings are stored (Fig. 1.2.c). Files are written to the “SAVED DATA” folder automatically and are stored in a folder identified by the respondent’s code and the sequential number of the recording (Fig. 1.2.d). In the respondent’s own folder, the file with the *.csv extension (where instead of * is the date and time of the recording) is the very file intended for loading into CleverView (Fig. 1.2.c).
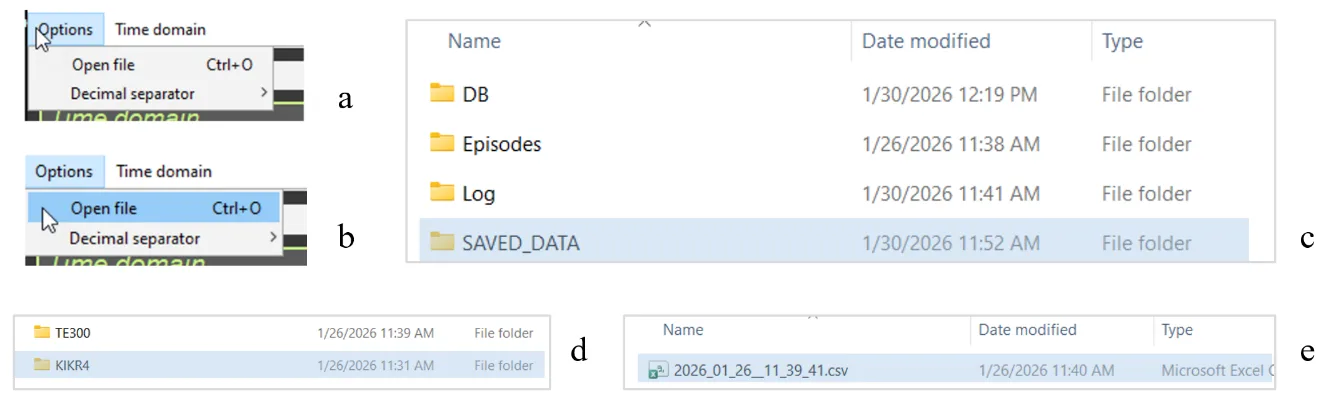
Figure 1.2. Step-by-step search for the required file to load.
Double-click the file with the *.csv extension and wait. We immediately make a reservation,
as this point is extremely important: during the internal operation of the program in CleverView – whether it is loading a file, a page, or mathematical processing of raw data – the Select file line (see Fig. 1.1) will be highlighted in red (Fig. 1.3).

Figure 1.3. Appearance of the window with the name of the selected file during the internal operation of the CleverView program.
During the internal operation of the program, it is strongly recommended to patiently wait until this window turns white and not to perform any actions using the keyboard or mouse buttons until that moment! The volume of digitized raw data is enormous, and any computer needs time to complete the initiated procedure. If you become fidgety while waiting for a response and begin to “demand” additional actions from the program, this will lead to overloading your computer’s support system, which may cause it to “freeze” and subsequently require spending time restoring the working state of your operating system.
Files of respondents who have completed testing can also be stored in other locations if you have such a need. For example, you may be collecting data on a certain problem, age, sex, etc. From the “SAVED DATA” folder, files are copied using standard methods. In this case, the navigation from “Open file” in CleverView to your file will simply be different. However, these are routine approaches to searching for the required file, which Windows users are familiar with. In your database, files can be renamed or you can make some notes in them. But these are already features of individual methods of organizing work.
In the “SAVED DATA” folder, we do not recommend making any changes or edits, since it is also accessed by the CleverPoint EVA program, which accumulates data there in the event of a respondent’s repeated or subsequent visit to you.
When the required file is loaded, the start page will display EEG curves (leads F8, AF4, AF3 and F7, located in the frontal regions on the facial pad), EMG (L and R Zygoma, located in the area of the zygomatic bone) and ECG (Cardio). The screen will show curves for the entire period of testing in Stressonika, and this is at least 20 minutes. Therefore, for each lead you will see dense “pickets” of bioelectric curves with which you will have to work (Fig. 1.4).
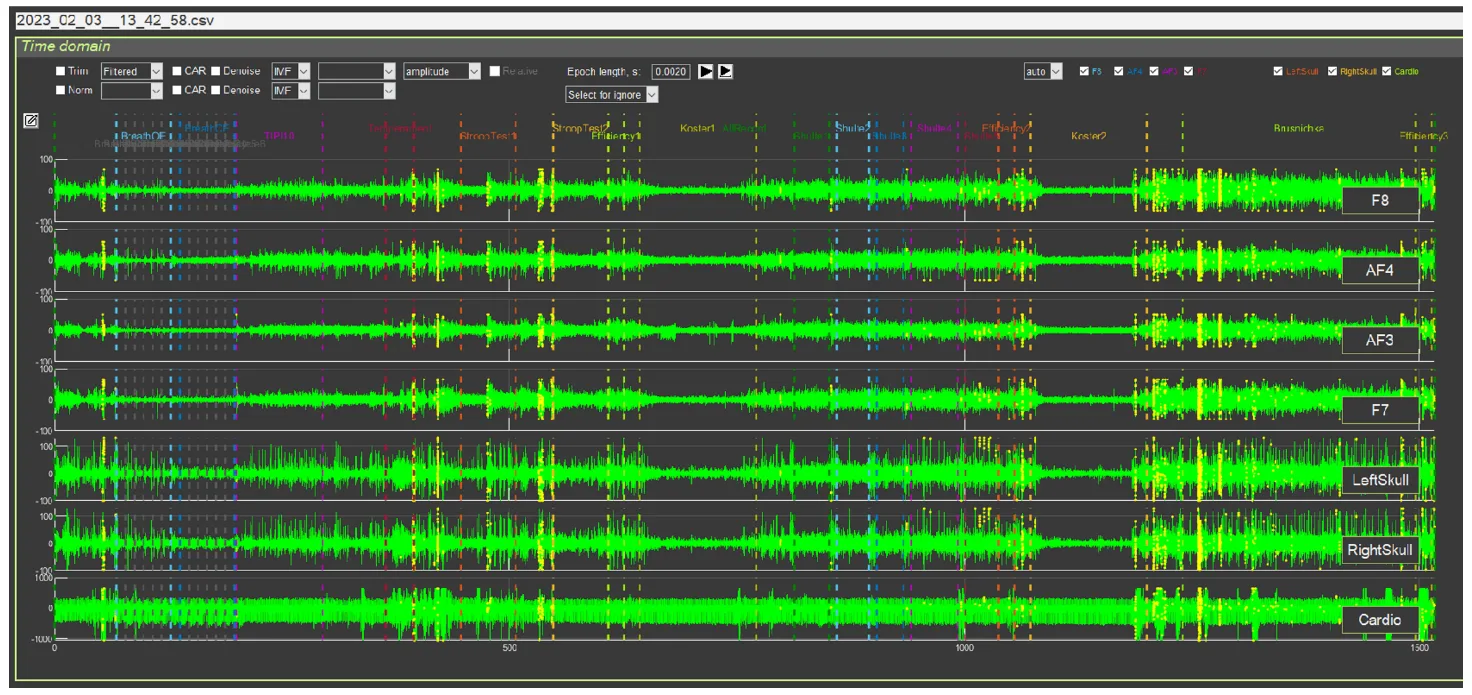
Figure 1.4. CleverView start page with a loaded file
The “Time domain” page is intended for working with the raw data of the signals displayed on it. We immediately draw your attention to the upper part of the screen, above the EEG curve in lead F8 (Fig. 1.5). In this place all stages of testing in Stressonika are indicated. Note the color designation of each stage, which will be repeated on every CleverView page. Each stage is also bounded by vertical dashed lines of the corresponding color, which allows, if necessary, to select the segment that interests us on the graphs.

Figure 1.5. Part of the screen indicating the stages of testing in Stressonika
Working with CleverPoint products is not limited to Stressonika. If you upload your own VR content into the system, you can place your own time markers and give them logical names. In this case, the number of markers and their titles will be different, but the principle – common to all pages – of color coding for selected specific stages of the study is preserved.
For an overall picture of the psycho-emotional state of a person who has been tested, and for illustrative help during a consultation, the “Cardio domain” page is the most suitable. We will turn to it to consider the most general points, and we will return to “Time domain” in the relevant chapter of the manual. Click on the “Time domain” window in the upper left corner of the screen (Fig. 1.6.a), select the “Cardio domain” tab (Fig. 1.6.b), and click once.
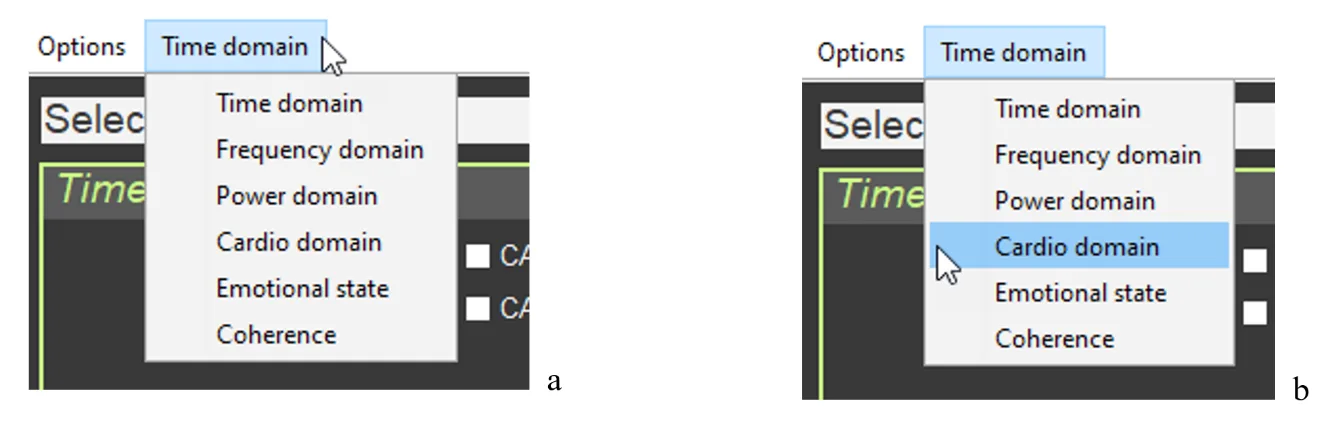
Figure 1.6. Step-by-step search for the page to load, using “Cardio domain” as an example
Wait for the screen to change and for the highlighting of the window with the name of the selected file in red to end. The structure of the “Cardio domain” page is shown in Figure 1.7.

Figure 1.7. “Cardio Domain” page for a loaded file with raw data
The “Cardio domain” page can be opened even before loading the file you need. To do this, after opening the “Time domain” page (Fig. 1.1), you first turn to the “Time domain” window (see Fig. 1.6), and only then, after opening the “Cardio domain” page, activate the file you need (see Fig. 1.2). Work in CleverView in the way that is convenient for you.
On the “Cardio domain” page, 5 graphs and digital data related to heart rate variability (HRV) are visualized. We will conduct a detailed analysis of this page in the next chapter. For now, we simply get used to it and will examine a few more general points: graph control and orientation by the stages of testing.
Let us return to Figure 6 and pay attention to the vertical bars on each of the graphs, and to the labels and ovals on the “cloud” of points on the graph on the right on the “Cardio Domain” page. Everything is the same as on the “Time domain” page (confirming what has already been said: the same system for marking the stages of testing in Stressonika will be preserved on other pages).
Now let us move the cursor to the upper right of one of the graphs… Icons appear that allow you to control the graph image (Fig. 1.8.a). Let us get acquainted with them. Examples of their use will be given in the next chapter.
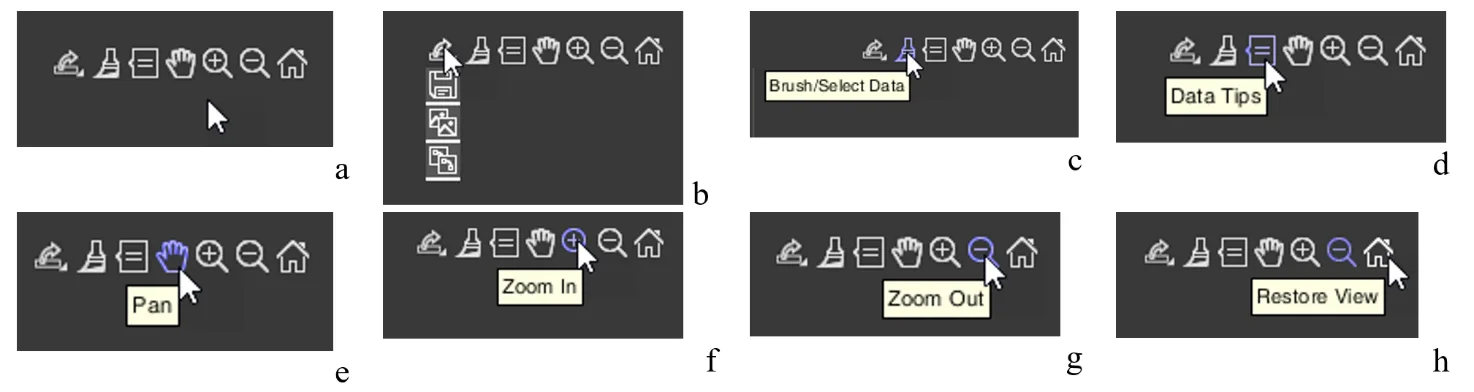
Figure 1.8. Icons for controlling the graph image (explanations in the text)
Let us immediately note that CleverView is based on the “MATLAB” software product, and the icons we will discuss are standard for this program. If you know how to work with “MATLAB”, you may skip the following description.
Graph image saving icon (Fig. 1.8.b). Clicking the corresponding pictogram will give you the opportunity to save the graph image where you want, and under the name you specify.
These are typical actions for programs built into Windows.
We do not impose tools for work on you. Both in programs built into Windows and in specialized image-processing programs integrated into Windows, there are similar functions. Work with those you are accustomed to, or that, in your opinion, are more convenient.
Icon for color highlighting of a segment of the graph – “Brush/Select Data” (Fig. 1.8.c). This function can be useful for creating an illustration in which you want to emphasize what is seen, described, or commented on.
Icon that allows you to place a marker on the graph – “Data Tips” (Fig. 1.8.d). Activating this icon gives you the opportunity to find out the exact coordinates of a point on the curve, with a window displaying the data of this point along the x- and y-axes. The coordinates are different for each graph. Their description will be provided in the chapters where these graphs will be described. Examples of using this icon will also be given there. It is possible to display data not for one point, but for several. This possibility opens when holding down the “alt” key on the keyboard.
Hand icon – “Pan” (Fig. 1.8.e) will allow you, while holding down the left mouse button on the graph with the corresponding cursor, to scroll the graph to the right or left, or shift it up or down.
The icon with the “+” sign – “Zoom In” (Fig. 1.8.f) opens the function of enlarging the graph horizontally or vertically; the icon with the “-” sign – “Zoom Out” (Fig. 1.8.g) – reduces it.
The last icon in the form of a house – “Restore View” (Fig. 1.8.h) – restores the original appearance of the graph after your actions with it. This function is very useful, and you will be convinced of this when you begin to routinely work with CleverView.
The general points are described. Now you can proceed to studying the individual pages of our CleverView software product.