Table of Contents
8.6.1. RR Tachogram #
Graph of RR intervals over time:
- Blue line: RR intervals
- Gray points: local minima (respiratory cycles)
- Green line: signal power (scaled)
- Gray vertical lines: section markers
8.6.2. RR Tachogram Spectrum #
FFT spectrum of the interpolated RR signal:
- X-axis: frequency (0–0.5 Hz)
- Y-axis: spectral amplitude
- LF (0.04–0.15 Hz) and HF (0.15–0.4 Hz) ranges are marked
- LF%, HF%, and LF/HF ratio are displayed
8.6.3. Poincaré Plot (Local Return Map) #
Scatter plot of RR(i) versus RR(i-1) or RR(i-shift):
- Each point: a pair of consecutive RR intervals
- Colors: different sections
- Ellipses: 2SD1 and 2SD2 for each section
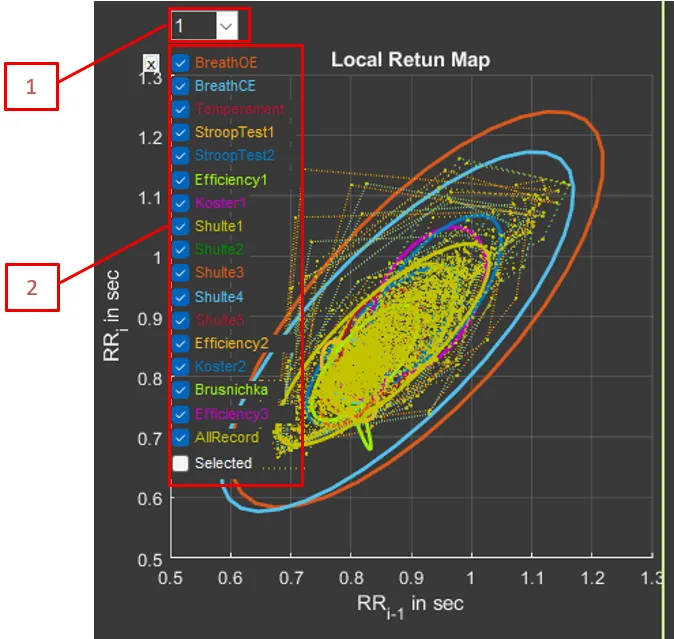
- Shift RR: shift for the Poincaré plot (1–15 intervals)
- Checkboxes for including or excluding sections
Physiological explanation of the Poincaré plot:
The Poincaré plot (return map) is a graphical way to visualize heart rate variability by showing the patterns of RR interval changes.
How to read the plot:
- Each point = a pair of consecutive RR intervals
- X-axis: RR(i-1), the previous interval
- Y-axis: RR(i), the current interval
- If the heart beat like a metronome, all points would be in one place.
Typical shapes:
Round/oval shape (healthy heart):
- high variability
- good adaptability
- healthy ANS state
- SD1 and SD2 are roughly equal
Elongated shape along the diagonal:
- low short-term variability (small SD1)
- long-term trends remain (larger SD2)
- possible stress or fatigue
- low SD1/SD2
Compact cloud:
- low variability overall
- very regular heartbeat
- possible health problems
- both SD1 and SD2 are small
Shifted center:
- change in mean RR
- transition between states (rest → load)
- response to a stimulus
Physiological meaning of SD1 and SD2:
- SD1 (minor axis):
- short-term variability
- beat-to-beat changes
- predominantly parasympathetic activity
- associated with respiratory arrhythmia
- SD2 (major axis):
- long-term variability
- trends and slow changes
- sympathetic + parasympathetic activity
- associated with the baroreflex and other slow regulatory processes
Clinical significance:
- Healthy people: round or oval cloud, SD1/SD2 ≈ 0.3–0.5
- Stress: the cloud becomes elongated, SD1 decreases
- Aging: the cloud becomes more compact, both SDs decrease
- Pathology: a very compact cloud or an unusual shape
8.6.4. Segmental HRV Analysis #
The graph shows the dynamics of HRV parameters over time:
- HR: heart rate
- FuncGroup: functional group (×10)
- ExtraPoint: additional score (×100)
- z(HR): pulse z-score
- z(SD1): SD1 z-score
- z(SD2): SD2 z-score
- RMSSD: RMSSD
- Relaxation: Relaxation
- Concentration: Concentration (from EEG)
- Breath: breathing rate
All parameters are calculated in a sliding window with 75% overlap.
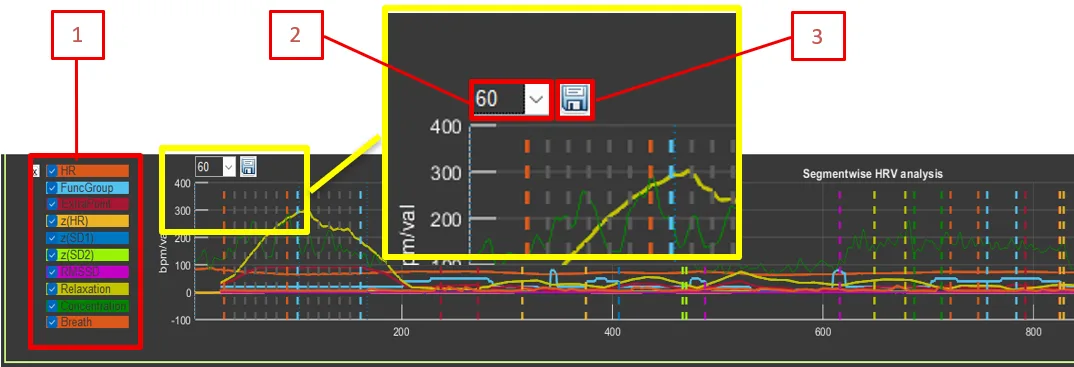
- Checkboxes for including or excluding HRV parameters
- Average Window: Averaging window for segmental analysis (10–100 intervals)
- Save continuously HRV: Save continuous HRV parameters over time