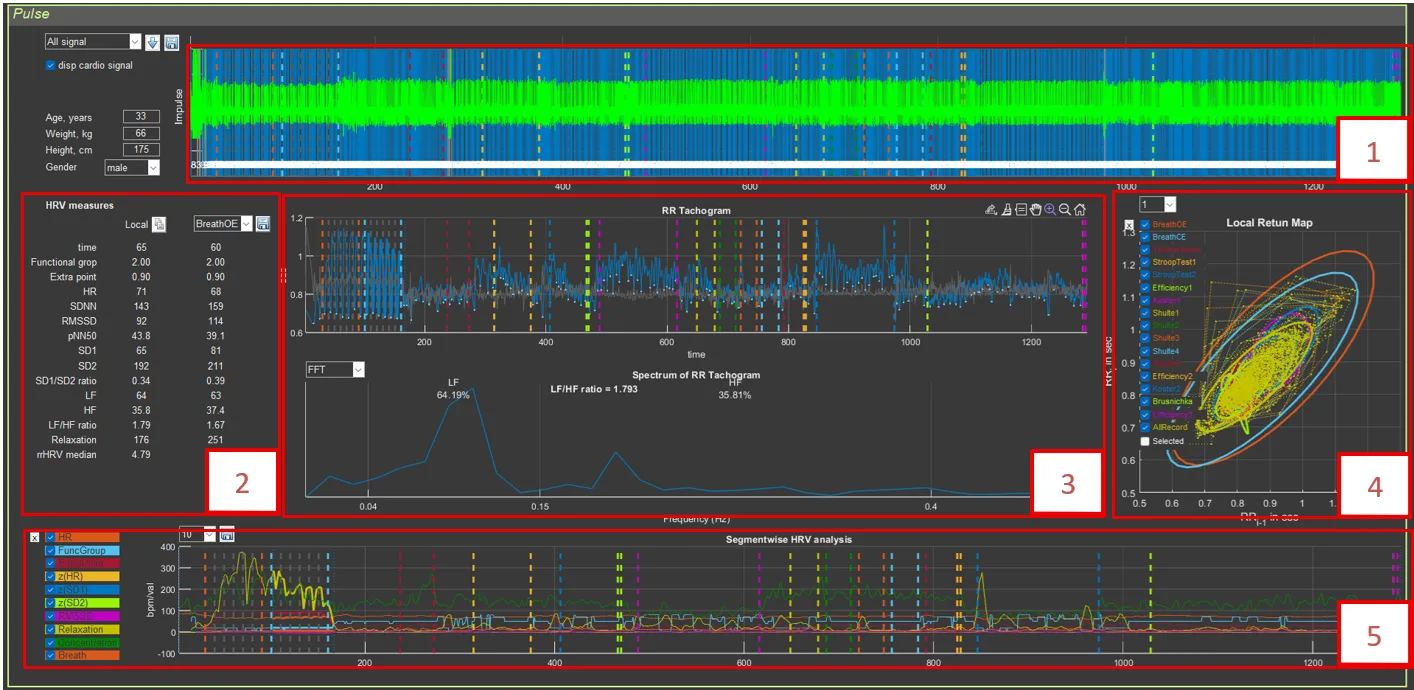
The interface contains:
- Top panel: visualization of pulses and RR intervals
- Middle left panel: HRV parameter table
- Middle center panel: RR tachogram and spectrum
- Middle right panel: Poincaré plot (Local Return Map)
- Bottom panel: segmental HRV analysis