The interface contains a 16-plot grid (4 × 4), where each cell corresponds to a pair of electrodes:
- F8–AF4, F8–AF3, F8–F7
- AF4–AF3, AF4–F7
- AF3–F7
For each pair, coherence curves are shown for all sections, and each section has its own color.
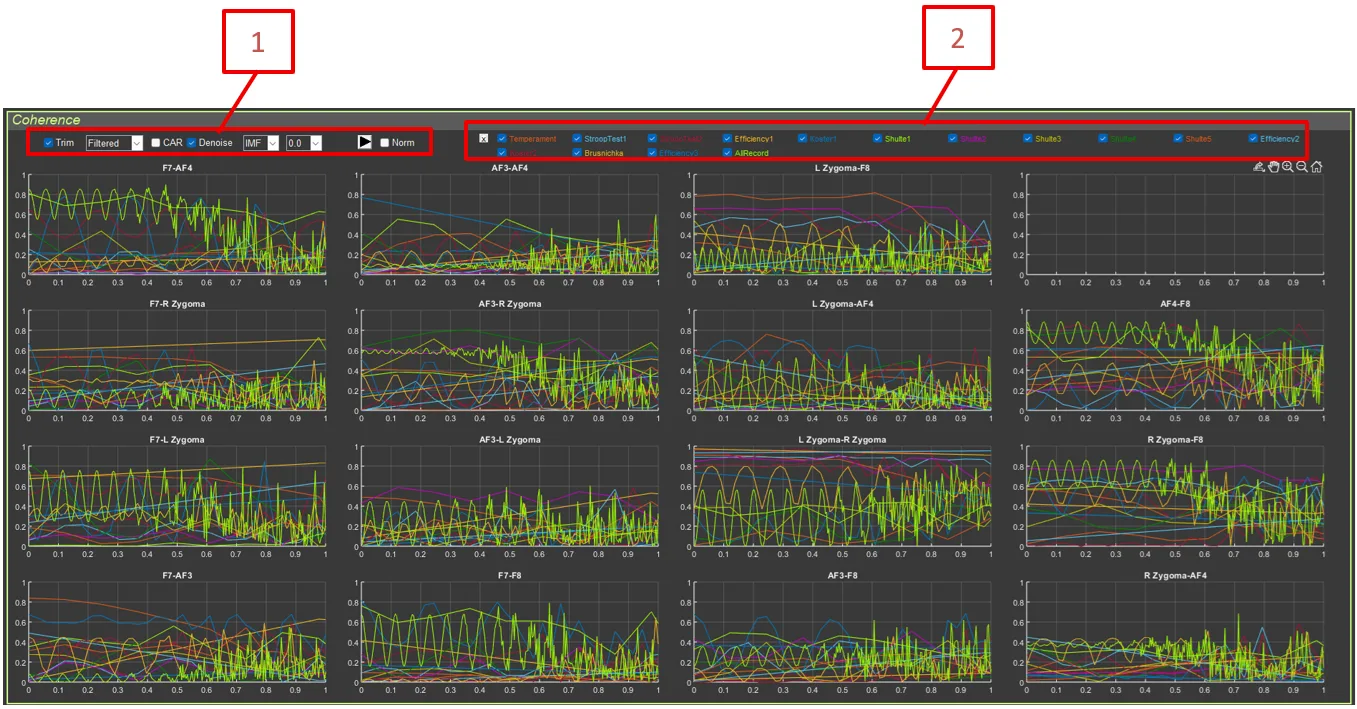
- Controls:
- Power: Checkbox for including or excluding sections