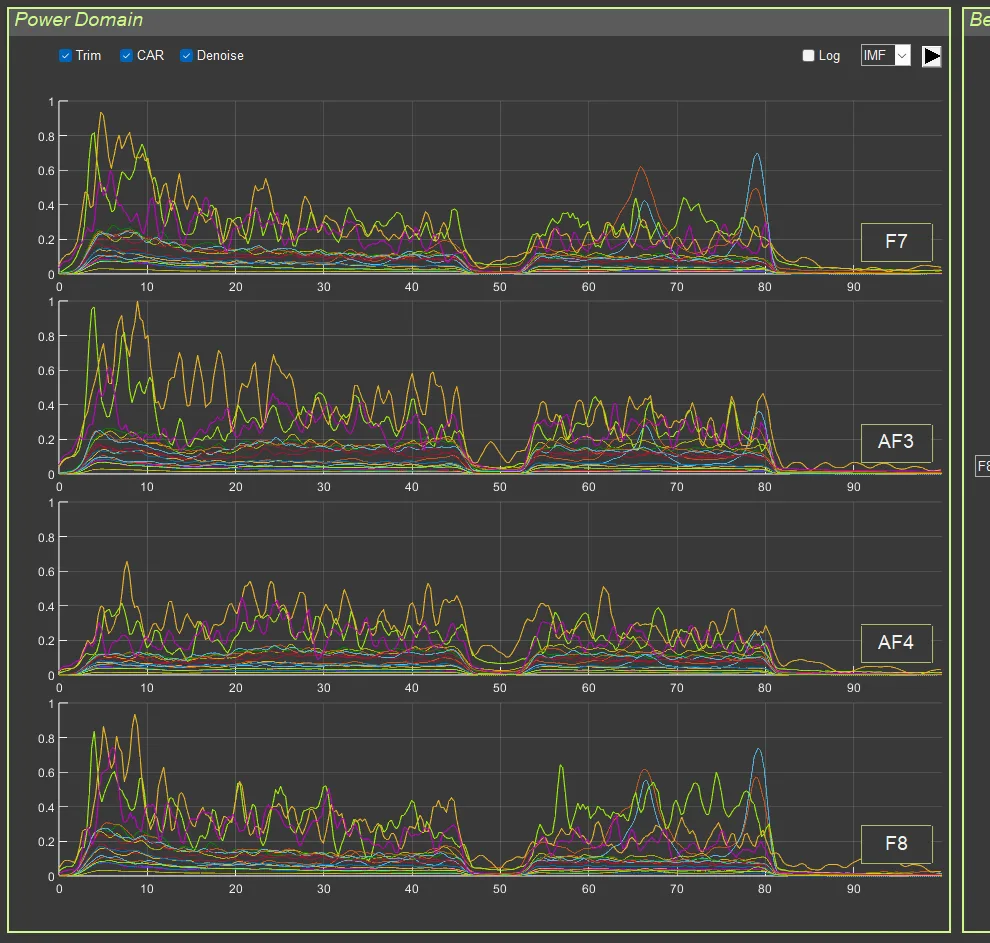
On the left side of the interface, power graphs for the four EEG channels (F7, AF3, AF4, F8) are displayed for all sections.
Method:
- FFT is computed for each section.
- A power spectrum is constructed:
P = abs(FFT(signal)) / length(signal) - Smoothing is applied.
- The spectrum from 0 to 100 Hz is displayed.
Colors: each section has its own color for visual distinction.