Table of Contents
5.2.1. Controls #
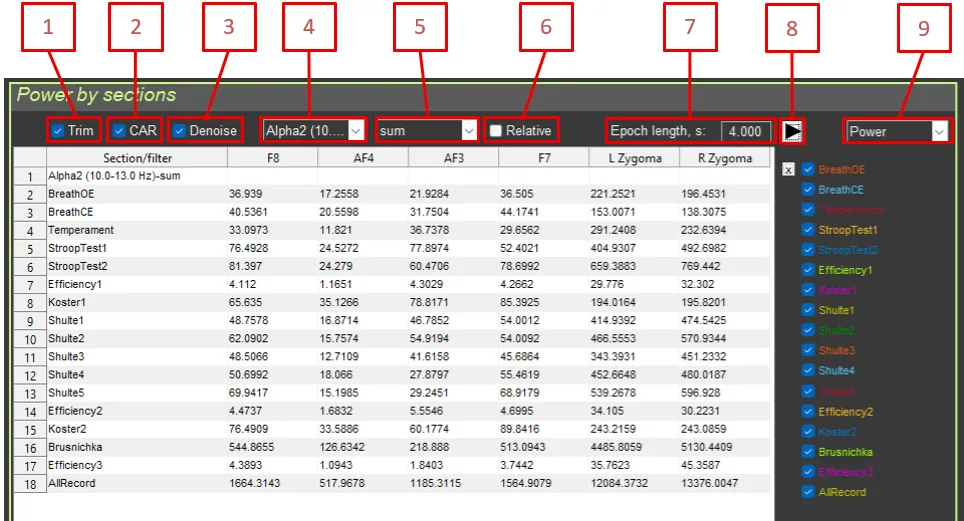
- Trim: Remove artifact segments
- CAR: Common average reference
- Denoise: Blink artifact suppression
- Filter: Frequency filter selection
- Function: Aggregation function (sum, mean, median, std)
- Relative: Relative values (percentage of the total spectrum)
- Epoch length: Epoch length for averaging
- Recalculation button
- Mode selection: Power by sections / Between-channel interactions
5.2.2. Results Table #
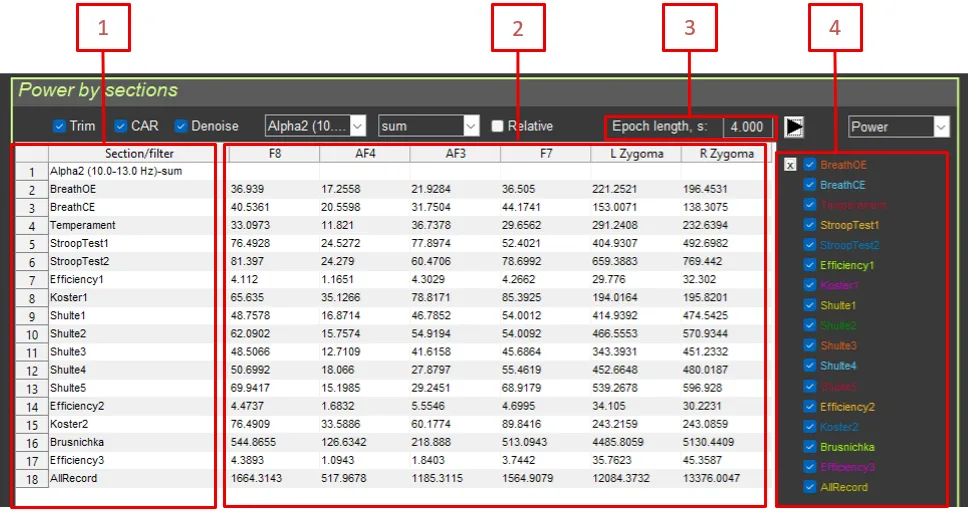
The table contains: #
- Section/filter: Section name or filter name
- F8, AF4, AF3, F7, L Zygoma: Power for each electrode
- Epoch length: Epoch length
- Power: Checkbox for including or excluding the section
5.2.3. Power Calculation Method #
- Transformations are applied: Trim, CAR, Denoise (blink artifacts)
- The frequency filter is applied (if selected)
- The signal is converted to power:
power = signal.^2 - Epoch averaging is applied:
power_smoothed = filtfilt(moving_average, 1, power) - An aggregate statistic is calculated for each section:
sum: sum(power_section) / Fs (power integral)
mean: mean(power_section) (mean power)
median: median(power_section) (median power)
std: std(power_section) (standard deviation)
5.2.4. Relative Values #
When Relative is enabled:
- Total power (without filtering) is calculated for each channel.
- Power in the selected band is expressed as a percentage:
relative_power = 100 * filtered_power / total_power
Interpretation: Percentage of power in the selected frequency band relative to the total signal power.
Physiological explanation of relative power:
Absolute power depends on many factors (contact quality, individual characteristics). Relative power shows what share of total brain activity belongs to a given frequency band.
- Relative power is more stable and makes it easier to compare people.
- It shows the “balance” between different rhythms.
Examples:
- Alpha 50%: half of the brain’s activity is alpha rhythm (strong relaxation)
- Beta 30%: one third of the activity is beta rhythm (active thinking)
- Theta 10%: one tenth of the activity is theta rhythm (light sleep or meditation)
Interpretation of changes:
- Increased relative alpha: transition toward relaxation
- Increased relative beta: transition toward active work
- A change in balance reflects a change in functional state