Table of Contents
3.3.1. Graph Structure #
- Each channel is displayed on a separate axis.
- All axes are synchronized in time (X-axis).
- EEG channels are synchronized in amplitude (Y-axis).
3.3.2. Event Markers #
- Vertical colored lines indicate events and sections.
- Different colors correspond to different sections.
- Section names are displayed above the graphs.
- Yellow dots indicate segments marked to be ignored.
3.3.3. Working with Sections #
- Edit episodes: Edit sections
- Add Sector (-): Add a segment to ignore (select with the cursor)
- Remove Sector (+): Remove a segment from the ignore list
- Editing changes are not saved back into the source file, but they affect section markers in the exported data.
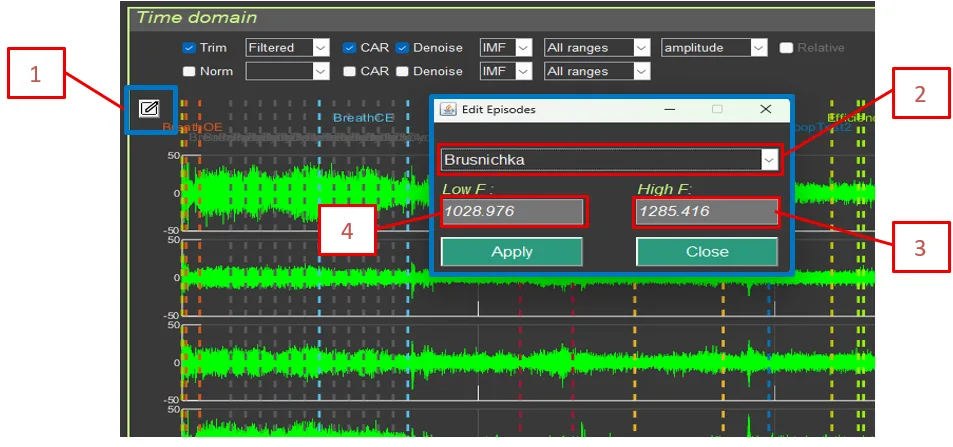
- Edit episodes includes:
- Section (episode) selection
- Section (episode) start time for calculations
- Section (episode) end time for calculations