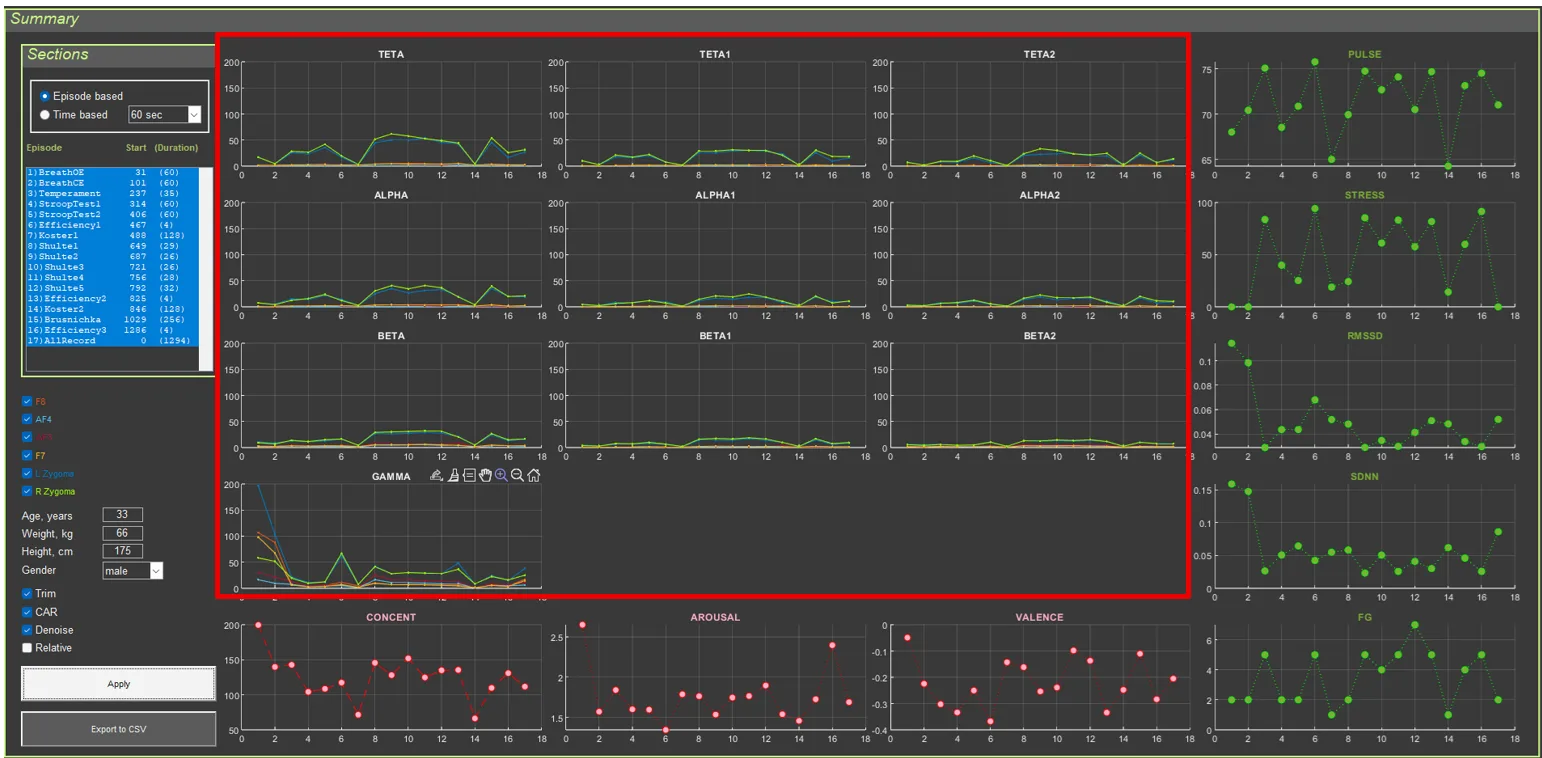
- 2.3.1. Frequency Bands (THETA, THETA1, THETA2, ALPHA, ALPHA1, ALPHA2, BETA, BETA1, BETA2, GAMMA)
- 2.3.2. Pulse (PULSE)
- 2.3.3. Stress (STRESS)
- 2.3.4. RMSSD (Root Mean Square of Successive Differences)
- 2.3.5. SDNN (Standard Deviation of NN Intervals)
- 2.3.6. Functional Group (FG)
- 2.3.7. Concentration (CONCENT)
- 2.3.8. Arousal (AROUSAL)
- 2.3.9. Valence (VALENCE)
2.3.1. Frequency Bands (THETA, THETA1, THETA2, ALPHA, ALPHA1, ALPHA2, BETA, BETA1, BETA2, GAMMA) #
Calculation method:
- A band-pass FIR filter is applied to isolate the frequency range.
- Power is calculated:
power = filtered_signal.^2 - The mean power value is calculated for each section.
Formula:filtered = filtfilt(fir_filter, 1, signal)
power = filtered.^2
section_power = mean(power(section_start:section_end))
Interpretation: Average signal power in the selected frequency range for each section.
Physiological explanation of power:
Power is the square of signal amplitude. It is a measure of the “energy” of activity in a given frequency range.
What power means:
- High alpha power: strong relaxation, calm state
- High beta power: active thinking, concentration, possibly stress
- High theta power: light sleep, meditation, creative state
- Low power in all bands: possibly artifacts, poor electrode contact, or a pathological condition
Comparison between sections:
- If alpha power is higher in a “Relaxation” section than in a “Stress test” section, this is normal and expected.
- If beta power is higher in a “Problem solving” section, this indicates active cognitive work.
- Changes in power reflect changes in the functional state of the brain.
2.3.2. Pulse (PULSE) #
Calculation method:
- RR intervals are extracted from the ECG signal.
- The mean pulse is computed for each section:
HR = 60 / mean(RR_intervals)
Interpretation: Average heart rate in beats per minute for each section.
Physiological explanation of pulse:
Pulse (heart rate, HR) is the number of heartbeats per minute. It is one of the simplest and most important indicators of the body’s state.
Normal values:
- At rest: 60–100 bpm (in adults)
- In athletes: 40–60 bpm (a trained heart)
- During exercise: can reach 140–180 bpm (depending on age)
- During sleep: 40–60 bpm
What affects pulse:
- Sympathetic activity: increases pulse (stress, physical exertion, emotions)
- Parasympathetic activity: decreases pulse (rest, relaxation)
- Physical exertion: increases pulse to supply muscles with oxygen
- Emotions: stress and anxiety increase it; calmness decreases it
- Age: maximum pulse declines with age
- Fitness level: trained people have a lower resting pulse
Interpretation of changes:
- Increased pulse: activation, stress, exertion, emotions
- Decreased pulse: relaxation, rest, recovery
- Sharp changes: response to a stimulus, transition between states
- Persistently high pulse: possible chronic stress or health problems
2.3.3. Stress (STRESS) #
Calculation method:
- Proprietary algorithm
- The value is limited to the range [0, 100]
Physiological explanation of stress:
Stress activates the sympathetic nervous system, which leads to:
- Increased heart rate
- Reduced heart rate variability (the heart beats more regularly, like a metronome)
- Changes in the shape of the Poincaré plot (the cloud of points becomes more elongated and compact)
Interpretation:
- Stress index from 0 (minimum stress) to 100 (maximum stress)
- 0–30: low stress, good recovery
- 70–100: high stress, possible overstrain
2.3.4. RMSSD (Root Mean Square of Successive Differences) #
Calculation method:RMSSD = sqrt(mean(diff(RR).^2))
Interpretation: A heart rate variability metric that reflects parasympathetic activity. Higher values = greater variability = more relaxation.
Physiological explanation of RMSSD:
RMSSD measures short-term changes in RR intervals (beat to beat). It is one of the most sensitive indicators of parasympathetic (vagal) activity.
How the parasympathetic system works:
- The vagus nerve sends signals to the heart.
- These signals modulate heart rate depending on the phase of breathing.
- During inhalation: pulse speeds up slightly.
- During exhalation: pulse slows down slightly.
- This creates the variability measured by RMSSD.
What the values mean:
- High RMSSD (>50 ms in younger people): good parasympathetic activity, relaxation, recovery
- Low RMSSD (<20 ms): reduced parasympathetic activity, stress, fatigue, possible health problems
- Normal values depend on age (higher in younger people, lower in older people)
Why this matters:
RMSSD is a marker of the body’s ability to recover. Athletes with high RMSSD recover faster after exercise. Low RMSSD may indicate overtraining or chronic stress.
2.3.5. SDNN (Standard Deviation of NN Intervals) #
Calculation method:SDNN = std(RR)
Interpretation: Overall heart rate variability. Reflects both sympathetic and parasympathetic activity.
Physiological explanation of SDNN:
SDNN is the standard deviation of all RR intervals. It is an integral measure of overall variability that reflects the functioning of the entire autonomic nervous system.
What affects SDNN:
- Parasympathetic activity: increases variability (respiratory arrhythmia)
- Sympathetic activity: may either increase variability (with moderate activation) or decrease it (under strong stress)
- Circadian rhythms: variability changes throughout the day
- Age: variability decreases with age
Clinical significance:
- High SDNN (>100 ms in younger people): good autonomic regulation, good health
- Low SDNN (<50 ms): reduced autonomic regulation, possible problems
- SDNN <20 ms: very low variability, high risk of cardiovascular events
Comparison with RMSSD:
- RMSSD is more sensitive to parasympathetic activity (short-term changes)
- SDNN reflects total autonomic regulation (all changes)
- Both parameters are important for a complete picture of ANS function
2.3.6. Functional Group (FG) #
Calculation method:
SD1 and SD2 are calculated from the Poincaré plot.
Mean pulse is calculated.
The findFunctionalGroup_Z function is used, which:
- normalizes SD1, SD2, and HR relative to age- and sex-specific norms (z-scores)
- determines the functional group (0–13) based on the combination of z-scores
- considers whether the section is a relaxation section (Calibration, Relax)
Physiological explanation of the functional group:
The functional group is a comprehensive assessment of the state of the autonomic nervous system based on normalization of HRV parameters relative to age- and sex-specific norms.
Interpretation: See the guide *Classification of Functional States*.
2.3.7. Concentration (CONCENT) #
Calculation method:
The signal from electrode AF4 is filtered into three ranges:
- Alpha (10–13 Hz)
- Beta (20–30 Hz)
- Gamma (30–90 Hz)
Envelopes are calculated using a 4-second window:envelope_alpha = filtfilt(moving_average, 1, abs(alpha_signal))
envelope_beta = filtfilt(moving_average, 1, abs(beta_signal))
envelope_gamma = filtfilt(moving_average, 1, abs(gamma_signal))
Concentration formula:Concentration = 20 * (envelope_beta + envelope_gamma) / envelope_alpha
Physiological explanation of concentration:
Concentration of attention is associated with activation of the prefrontal cortex and suppression of distracting signals. This is reflected in changes in the ratio of EEG frequency bands.
Neurophysiology of concentration:
- Alpha activity (8–13 Hz): associated with relaxation and the absence of active processing
- Beta activity (13–30 Hz): associated with active thinking and information processing
- Gamma activity (30–90 Hz): associated with information binding and attentional focus
What this means:
- During concentration: beta and gamma increase (active processing), alpha decreases (less relaxation)
- During distraction: alpha may be high (relaxation), while beta and gamma are low (no active processing)
Interpretation of values:
- Low values (<10): scattered attention, relaxation, possible drowsiness
- Medium values (10–30): normal concentration
- High values (>30): high concentration, active mental work, possibly tension
Why AF4 is used:
AF4 (right hemisphere, anterior frontal area) is used because this area is important for:
- Attention control
- Suppression of distracting stimuli
- Working memory
- Executive functions
2.3.8. Arousal (AROUSAL) #
Calculation method:
- Signals from AF3 and AF4 are filtered into alpha (8–13 Hz) and beta (13–30 Hz) ranges.
- Power is calculated in an 8-second window:
power_alpha = 1 + log10(sum(alpha_signal.^2) / window_length)
power_beta = 1 + log10(sum(beta_signal.^2) / window_length)
Arousal formula:Arousal = (AF3_beta + AF4_beta) / (AF3_alpha + AF4_alpha)
- Values are clipped at the 95th percentile to remove outliers.
Physiological explanation of arousal:
Arousal is the general level of activation of the nervous system, ranging from deep sleep to severe stress.
Neurophysiology of arousal:
Low arousal: alpha rhythm dominates (8–13 Hz)
- relaxed wakefulness
- eyes closed
- meditation
- calm state
Medium arousal: mixed activity
- eyes open
- normal activity
- balance of alpha and beta
High arousal: beta rhythm dominates (13–30 Hz)
- active thinking
- problem solving
- stress
- anxiety
- physical activity
Interpretation:
- Low values (<0.5): low arousal, relaxation, possible drowsiness
- Medium values (0.5–1.5): normal arousal, wakefulness
- High values (>1.5): high arousal, stress, active mental work
Practical significance:
- Persistently high arousal may indicate chronic stress or anxiety.
- Very low arousal may indicate depression, fatigue, or drowsiness.
- Optimal arousal depends on the task (low for rest, medium to high for work).
2.3.9. Valence (VALENCE) #
Calculation method:
- The same alpha and beta power values used for arousal are used.
Valence formula:Valence = (AF4_alpha / AF4_beta) - (AF3_alpha / AF3_beta)
- Values are clipped at the 95th percentile.
Physiological explanation of valence:
Valence is the evaluation of an emotion as pleasant or unpleasant. Research shows that the left and right hemispheres process emotions differently.
Theory of hemispheric asymmetry (Davidson, 1992):
Left hemisphere (AF3):
- processing of positive emotions
- approach behavior
- activity and enthusiasm
- high alpha = low activation = relaxed but positively oriented state
Right hemisphere (AF4):
- processing of negative emotions
- withdrawal behavior
- caution and anxiety
- high alpha = low activation = relaxation, but with possible negative valence
Interpretation:
- Positive values:
- the right hemisphere is more relaxed (high alpha/beta)
- the left hemisphere is more active (low alpha/beta)
- positive emotions, pleasure, joy
- Negative values:
- the left hemisphere is more relaxed
- the right hemisphere is more active
- negative emotions, sadness, anxiety, discomfort
- Close to zero: neutral emotions, balance
Important to understand:
- Alpha activity is inversely related to cortical activation.
- High alpha/beta = low cortical activation in that hemisphere.
- Low alpha/beta = high cortical activation in that hemisphere.
- The signal is influenced by tension in the forehead muscles.
Practical significance:
- Persistently negative valence may indicate depression or anxiety.
- Positive valence during relaxation is a good sign.
- Changes in valence reflect emotional reactions to stimuli.